Figures & data
Table 1. Related studies on hybrid systems for powering telecom base stations
Table 2. Review of existing studies on hybrid systems for Ghana
Figure 1. Map showing the location of the study area
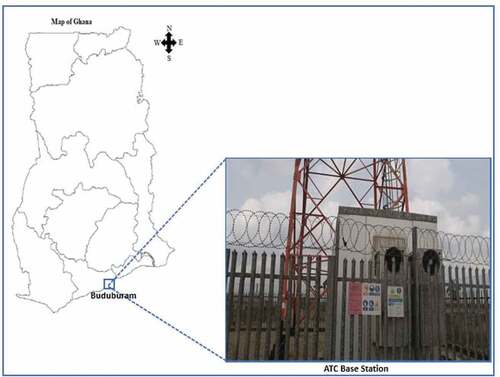
Table 3. List of electrical appliances/equipment for base station load assessment
Figure 2. Clearness index and solar global horizontal irradiation for Buduburam
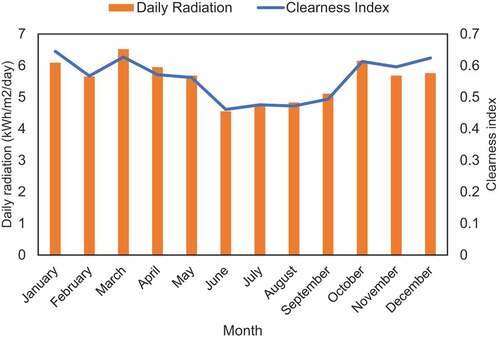
Figure 3. Steps utilized in HOMER software
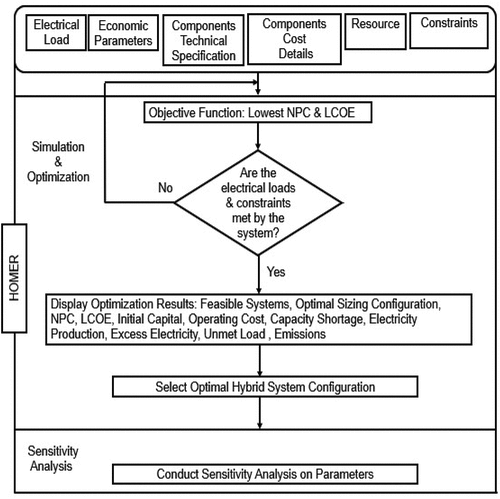
Figure 4. The layout of the proposed hybrid power system
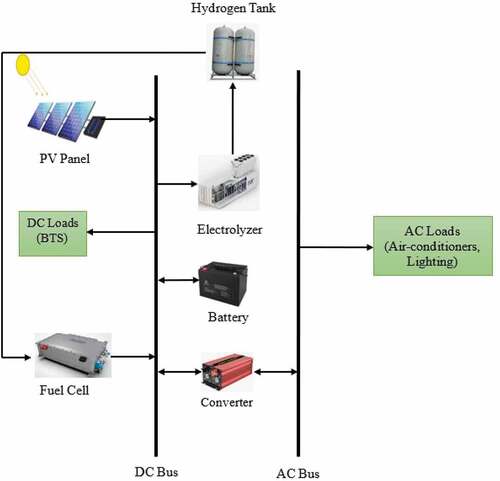
Figure 5. Cost of PV panels with accessories (cables, mounting structure)
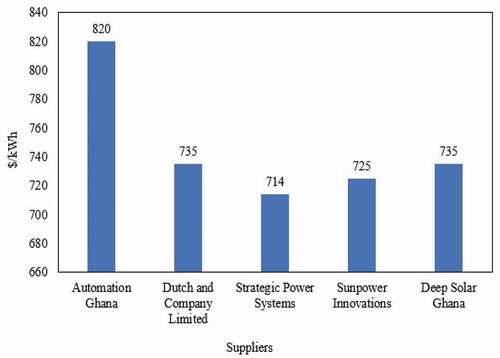
Table 4. Review of cost for fuel cell, electrolyzer, and hydrogen tank for HOMER simulation
Table 5. Summary of technical input parameters for sizing optimal hybrid system
Table 6. Summary of components cost for simulation
Figure 6. Buduburam ATC base station hourly load profile
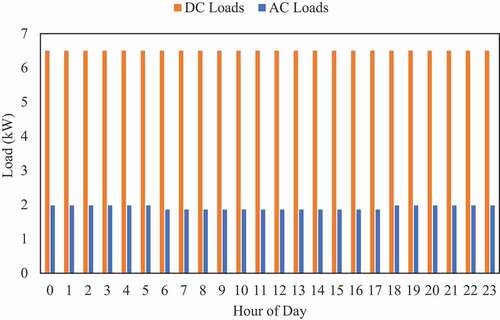
Figure 7. Screenshot of modelled PV/Fuel cell hybrid system using HOMER
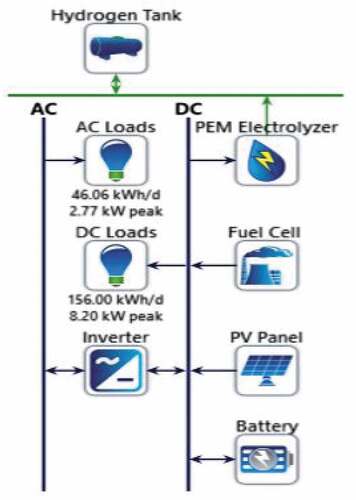
Table 7. HOMER optimum results for hybrid power systems
Table 8. Electricity produced and consumed
Figure 8. PV and fuel cell monthly electricity generation
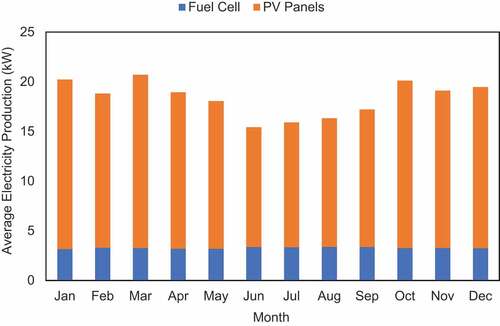
Figure 9. Cost breakdown for components
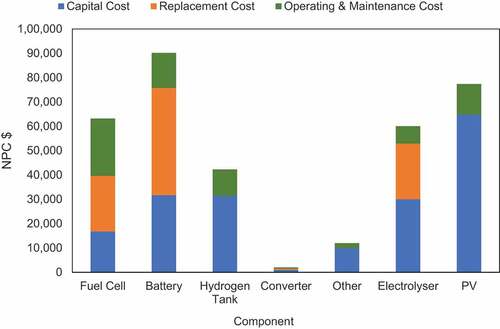
Figure 10. Effect of discount rate on NPC and LCOE
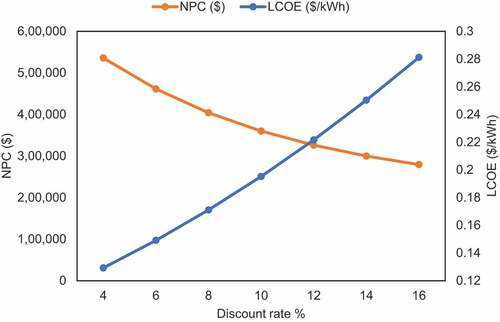
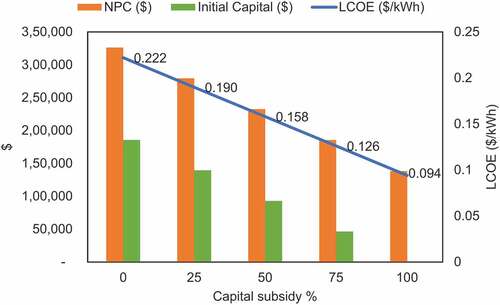
Figure 11. Effect of capital subsidy on NPC and LCOE