
Figures & data
Figure 1. Location of Murera reservoir
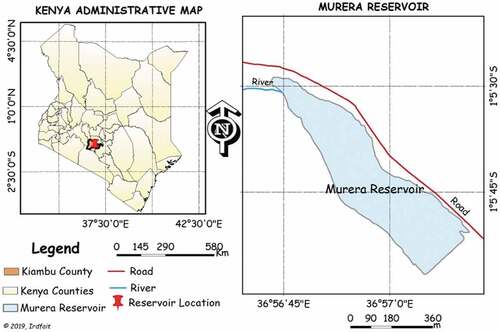
Figure 2. Bathymetry survey equipment set up
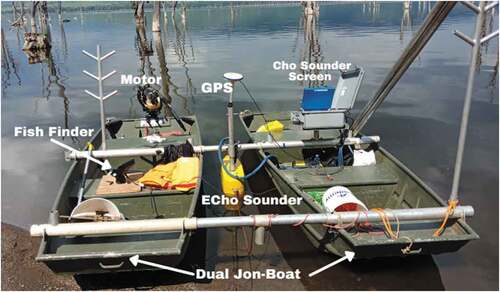
Figure 3. Acoustic depth measurement concept (Iradukunda et al., Citation2020) where the “d” is the depth of water, “D” is the depth to the post-impoundment layer, “t” is sound travel time and “v” is the sound velocity in water
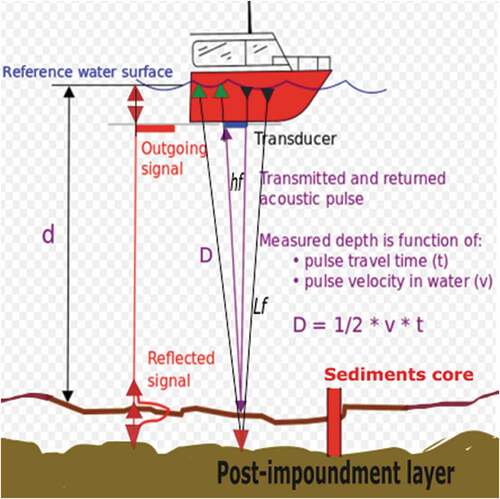
Figure 4. Waypoints recorded during Murera reservoir bathymetric survey
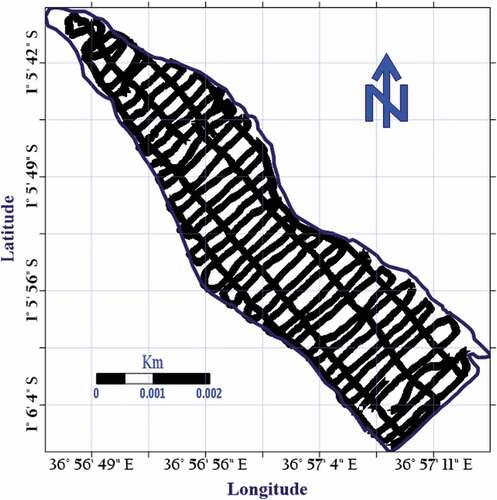
Figure 5. Murera reservoir contour map
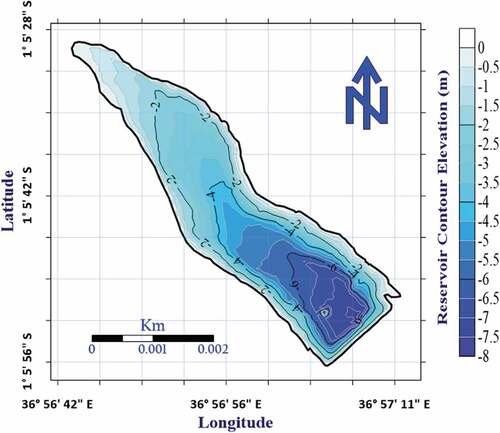
Figure 6. Longitudinal and transversal water depth profile section for Murera reservoir
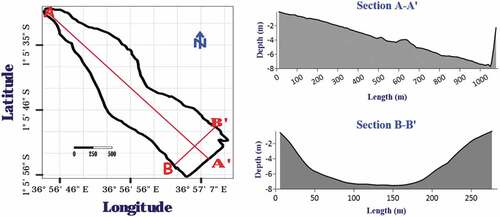
Figure 7. A graphical representation chart of water depth, volume, Area (a) and volume, Area relationship for Murera reservoir
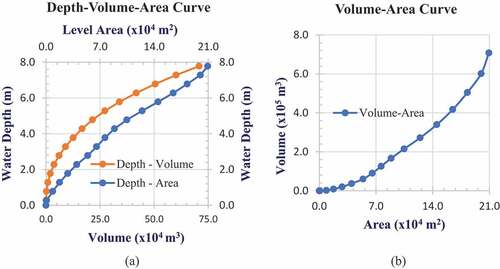
Figure 8. (a) Map of Murera reservoir sediments dispersion and (b) the profile of sediment layer thickness
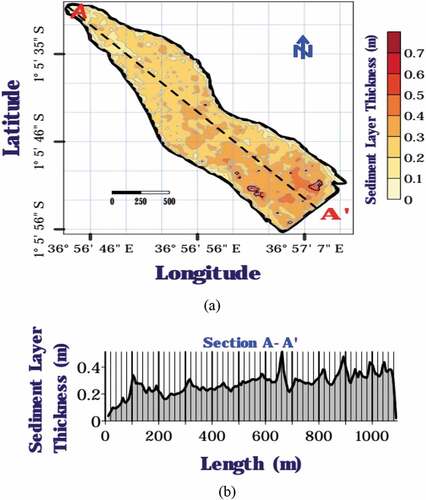
Figure 9. A graphical representation chart of sediment layer thickness, volume, area (a) and layer thickness, volume relationship for Murera reservoir
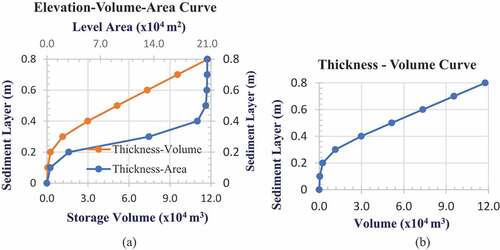
Figure 10. Murera reservoir storage loss
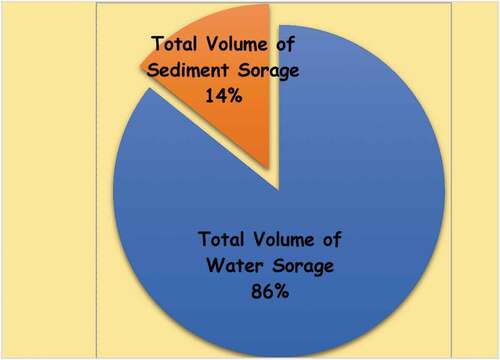
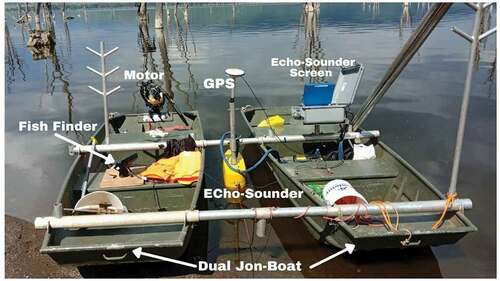
Table A1. Murera reservoir water storage and affiliative level area
Table A2. Murera reservoir sediment storage and affiliative level area