Figures & data
Figure 1. (a) XRD plots of the CuO nanoparticles showing different preferential crystallographic growth directions. (b) Modelled XRD patterns for (i) CuO-S60, and (ii) CuO-N60. (c) Lognormal distribution of crystallite sizes
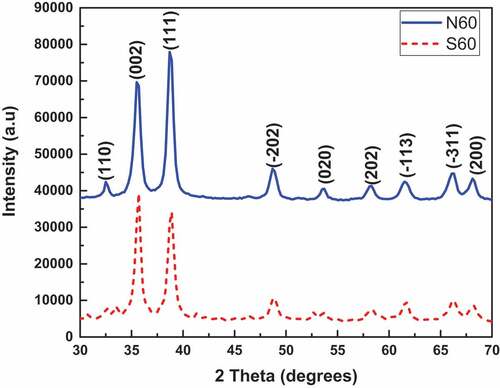
Figure 1. Continued
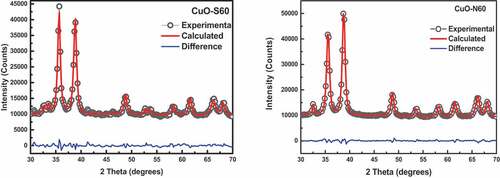
Figure 1. Continued
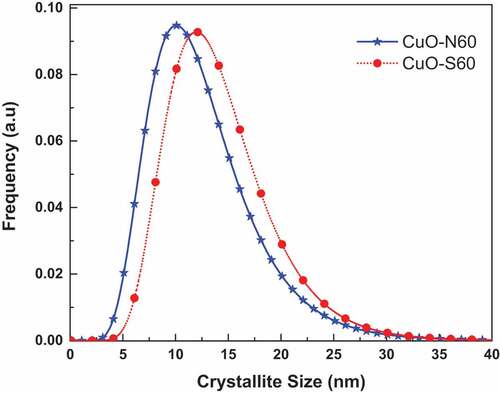
Figure 2. SEM images of (a) CuO-S60 and (b) CuO-N60
Figure 3. (a) (i) Energy dispersive x-ray spectrum and (ii) atomic weight distribution of Cu and O in CuO-S60 sample. (b) (i) Energy dispersive x-ray spectrum and (ii) atomic weight distribution of Cu and O in CuO-N60 sample
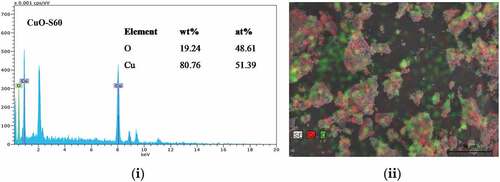
Figure 3. Continued
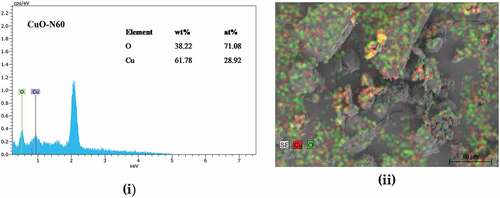
Figure 4. UV-Vis spectra of the as-prepared nanostructured CuO specimen
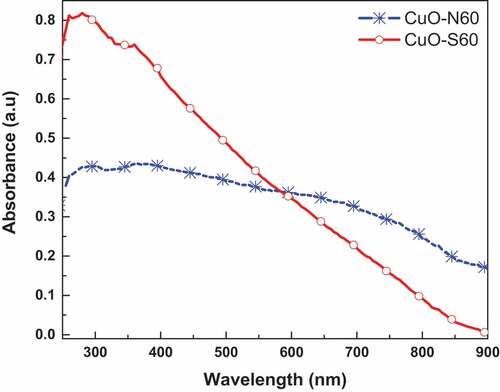
Figure 5. FTIR spectra for the synthesized CuO samples
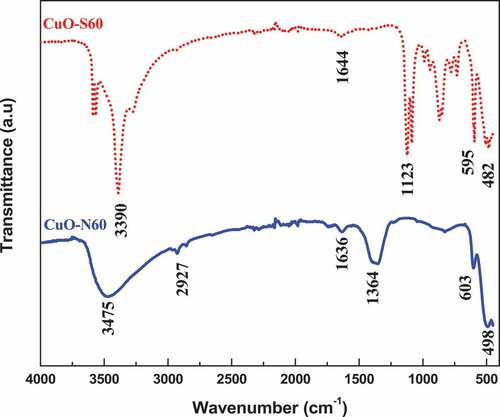
Figure 6. Nitrogen adsorption–desorption isotherms of (a) CuO-S60 and (b) CuO-N60
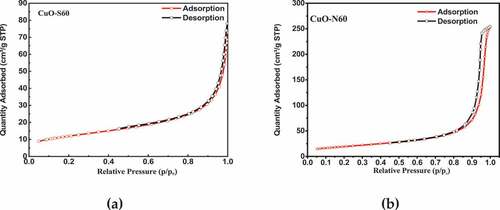
Table 1. Summary of the analytical parameters for the prepared nanostructured CuO crystals
Figure 7. Synopsis of mean percentage rate of dye degradations for each CuO specimen in each dye
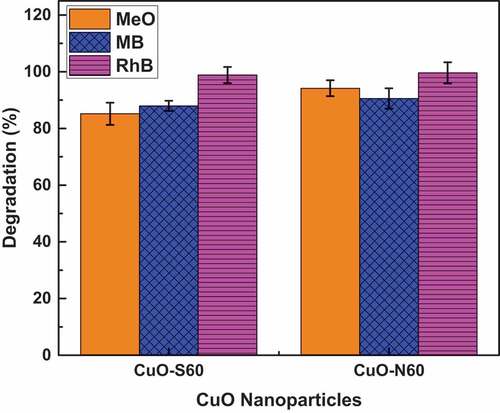
Figure 8. UV-Vis absorbance spectra for the degradation of (a)MeO, (b) MB and (c) RhB dyes using CuO-N60
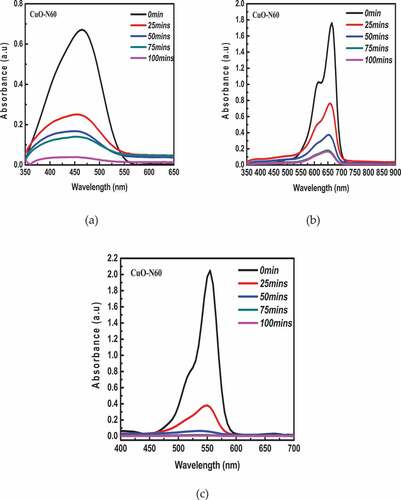
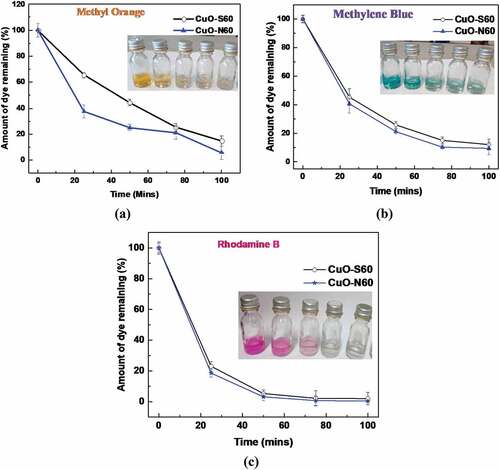
Figure 9. Variation in percentage dye concentration with time for MeO, MB and RhB (Inset: shows colour change for photocatalysis of: (a) MeO, (b) MB, and (c) RhB, respectively)