Figures & data
Figure 1. Quantities of original articles and reviews which were published in WoS and Scopus databases
Table 1. Main types of published documents: a) WoS and b) Scopus
Figure 2. Documents by year in Scopus and WoS
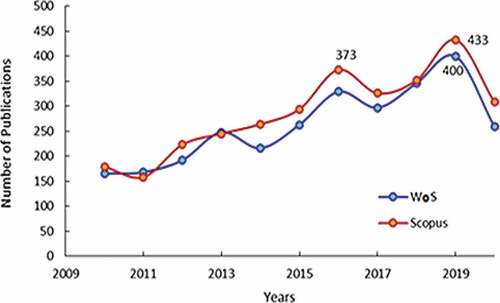
Figure 3. Documents by subject area: (a) WoS and (b) Scopus
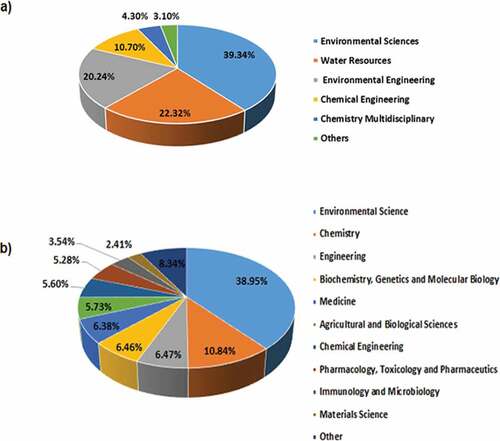
Figure 4. Sources of studies: (a) WoS and (b) Scopus
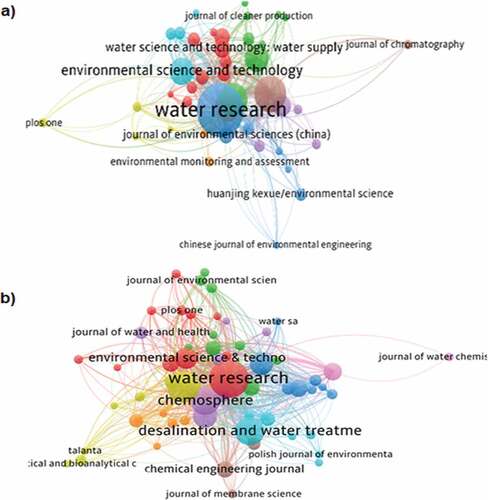
Table 2. Top 10 WoS journals
Table 3. Top 10 Scopus journals
Figure 5. Map of co-occurrence of keywords: (a) WoS and (b) Scopus. Source: VOS Viewer
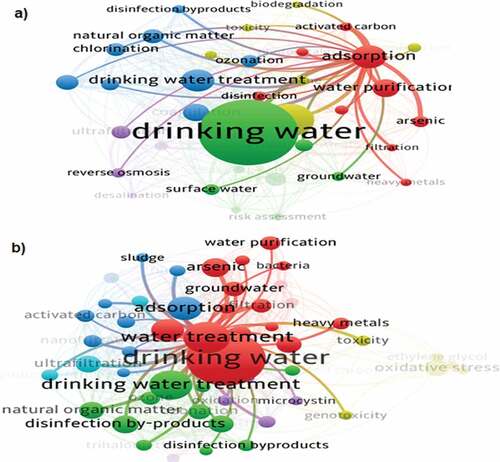
Figure 6. Network visualization of major countries in water treatment research: (a) WoS and (b) Scopus
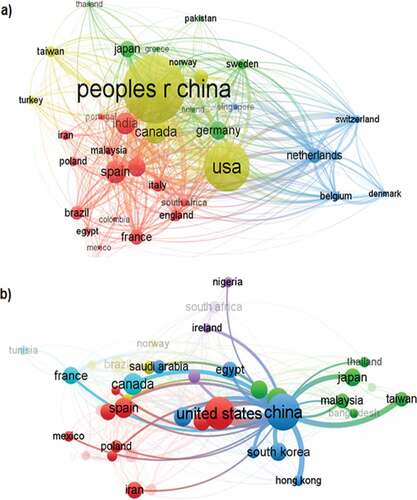
Figure 7. Visualization of the main institutions in drinking water treatment research: (a) WoS and (b) Scopus
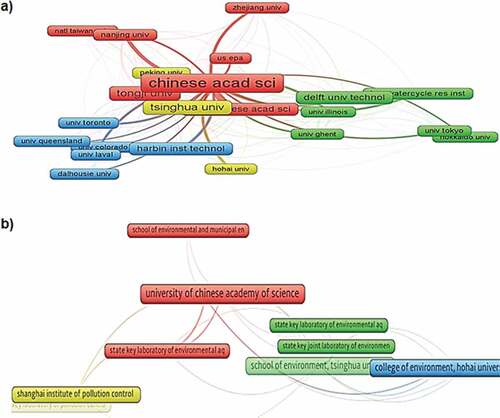
Figure 8. Visualization of the main authors in drinking water treatment research: (a) WoS and (b) Scopus
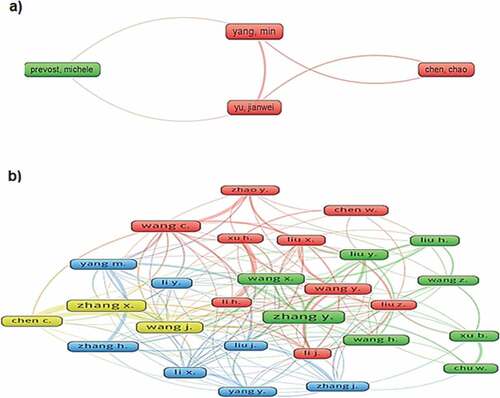
Table 4. Top ten most cited papers related to drinking water treatment in WoS
Table 5. Top ten documents with more citations related to potabilization in Scopus
Table 6. Articles most cited in WoS and Scopus: drinking water treatments
Figure 9. Technologies used: (a) WoS and (b) Scopus
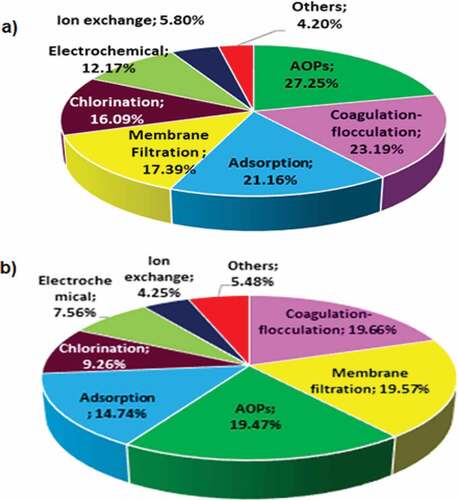
Figure 10. Main pollutants studied: (a) WoS and (b) Scopus
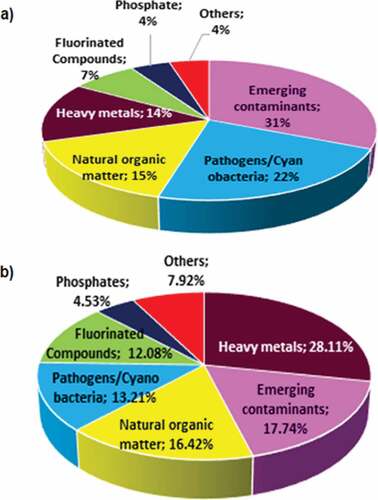
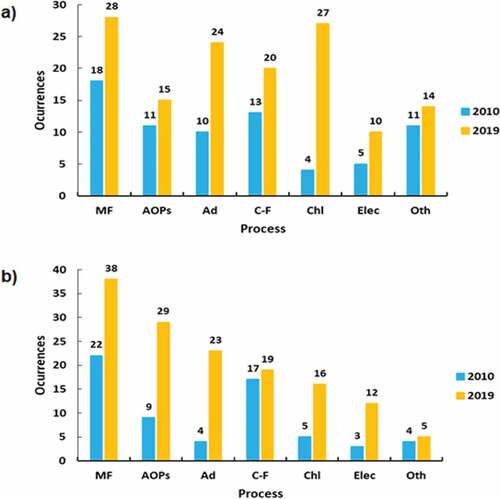
Figure 11. Pollutants removed in the year 2010 and 2019: (a) WoS and (b) Scopus