
Figures & data

Table 1. Physical and chemical properties of OPC and GGBS
Table 2. Properties of natural aggregates
Table 3. Particle size distribution of aggregates
Figure 1. Ready-mix concrete facility
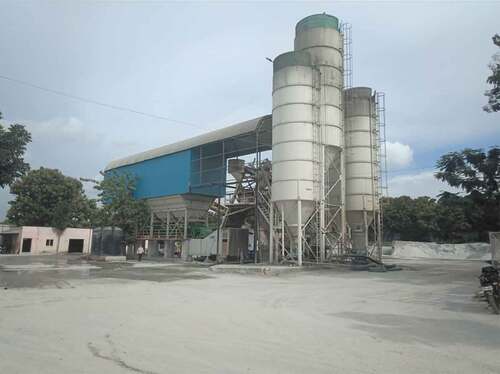
Table 4. Details of mix proportions evaluated
Figure 2. Process of concrete production and testing (a) concrete pan mixer, (b) fresh concrete mix, (c) preparation of concrete cube specimens, (d) compressive strength test, and (e) RCPT in progress
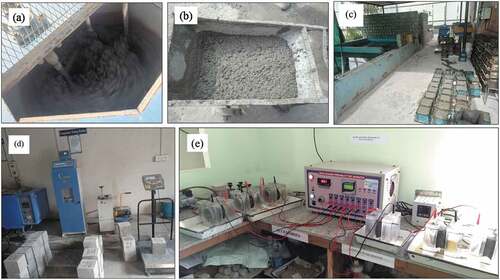
Table 5. Tests on fresh concrete
Table 6. Tests on hardened concrete
Table 7. Chloride ion penetrability based on charge passed
Figure 3. Rate of slump loss of fresh concrete
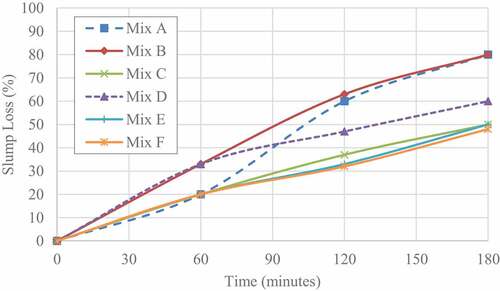
Table 8. Fresh properties of various mix types
Figure 4. Compressive strength of mixes evaluated
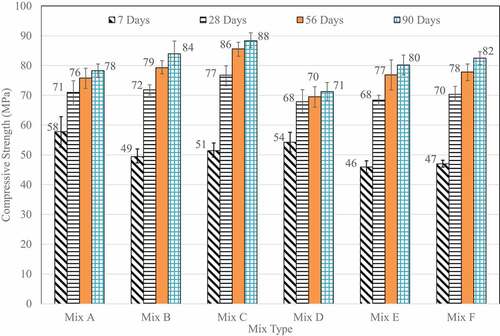
Figure 5. Strength gain in concrete at various curing time with respect to 7-day strength
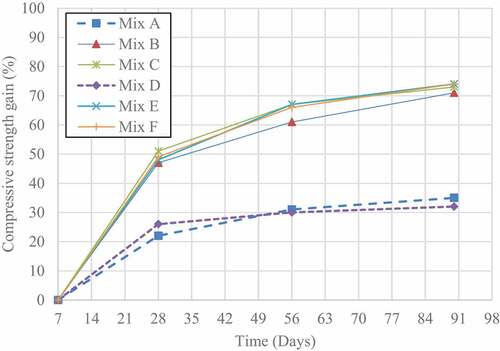
Figure 6. Percent difference in compressive strength with respect to control mix
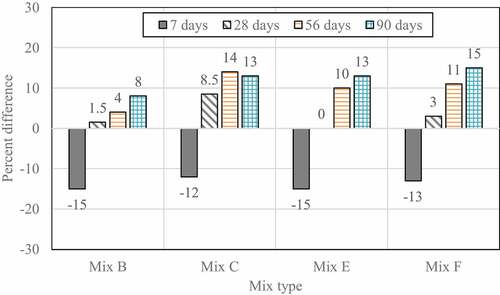
Figure 7. Water absorption of mixes evaluated
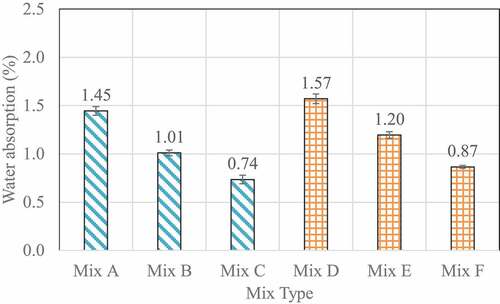
Figure 8. Permeability of mixes evaluated
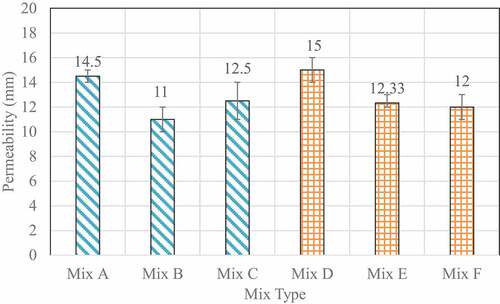
Figure 9. RCPT of various mixes
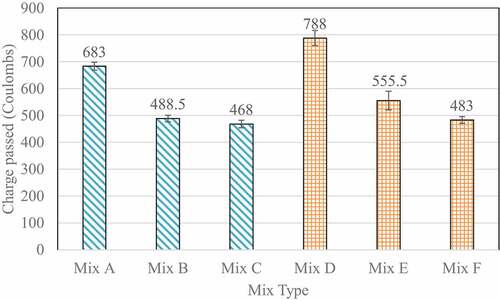
Figure 10. Chemical resistance of various mixes
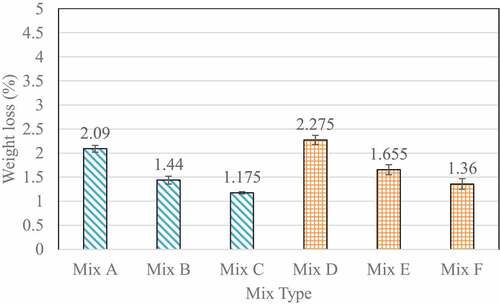
Table 9. Details of cost for various proposed mixes