Figures & data
Figure 1. Image of (a) banana plant (b) banana fiber used in the study
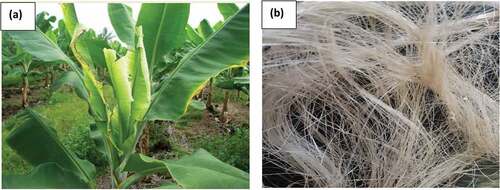
Figure 2. (a) Snail shell powder; (b) waste packaging paper pulp; (c) untrimmed paperboard
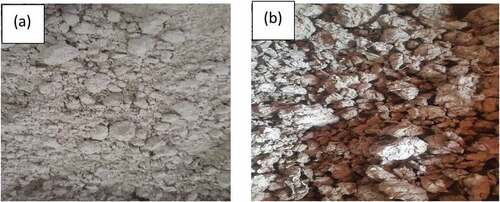
Table 1. Mix proportion in composites samples
Table 2. Properties of Cement
Table 3. Chemical composition of snail shell powder additive
Table 4. Chemical composition of treated and untreated banana fiber
Figure 3. Surface morphology of (a) untreated and (b) 1 M NaOH treated banana fiber
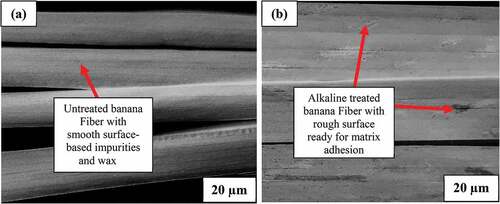
Figure 4. Surface morphology and EDX analysis of snail shell powder
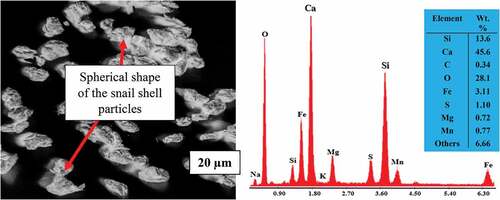
Figure 5. Variation in water absorption at curing days of (a) 28 days and (b) 56 days with (c) experimental trend index (d) efficiency values of the experimental variables
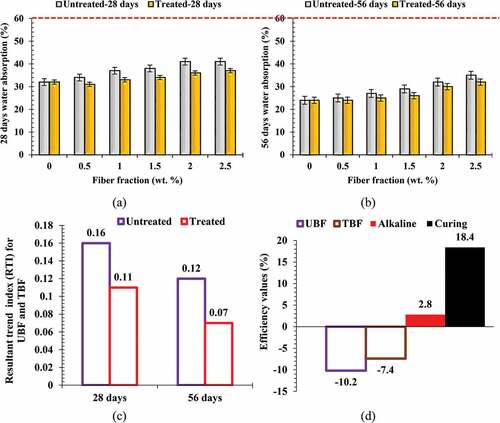
Figure 6. Variation in thickness swelling at curing days of (a) 28 days and (b) 56 days with (c) experimental trend index (d) efficiency values of the experimental variables
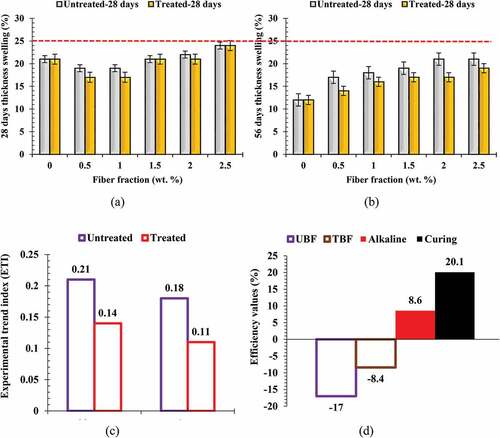
Figure 7. Variation in surface screw holding strength at curing days of (a) 28 days and (b) 56 days with (c) experimental trend index (d) efficiency values of the experimental variables
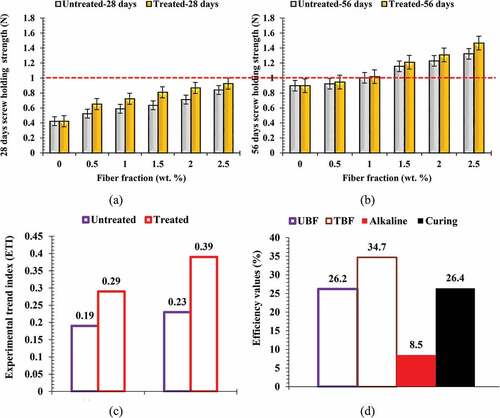
Figure 8. Variation in modulus of rupture at curing days of (a) 28 days and (b) 56 days with (c) experimental trend index (d) efficiency values of the experimental variables
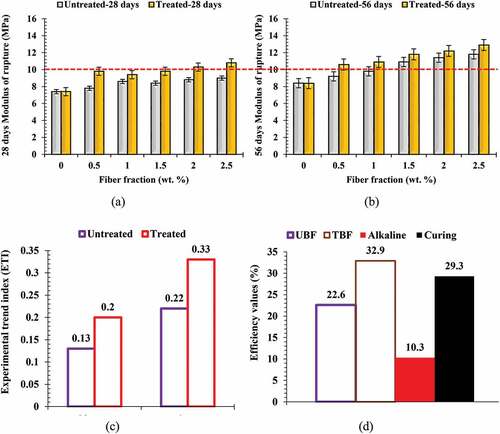
Figure 9. Variation in modulus of elasticity at curing days of (a) 28 days and (b) 56 days with (c) experimental trend index (d) efficiency values of the experimental variables
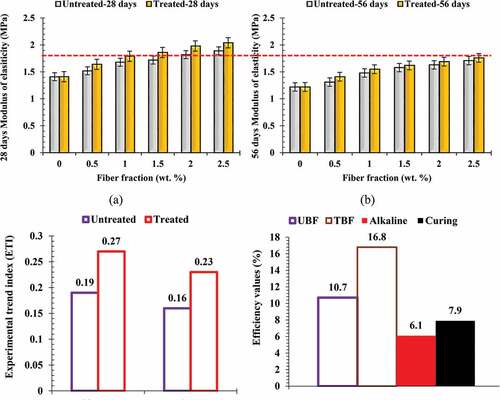
Table 5. Experimental variable efficiency table
Figure 10. Resultant efficiencies of experimental variables
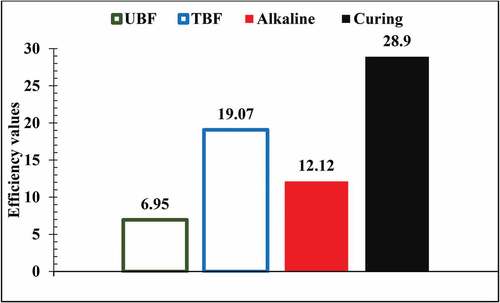
Table 6. Response index for composites in comparison with standard values
Table 7. Compliance index of composites reinforced with fiber proportion (0–2.5%)
Table 8. Effective Property Index (EPI) of developed composite reinforced with 0–2.5 wt.% UBF and TBF
Figure 11. Measurement of alkaline treatment and curing potential through (a) mean property index (b) efficiency of alkaline treatment and hydration
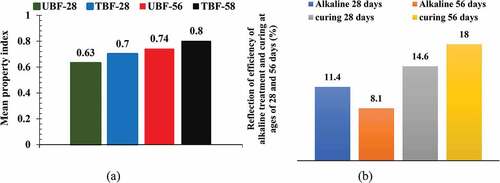
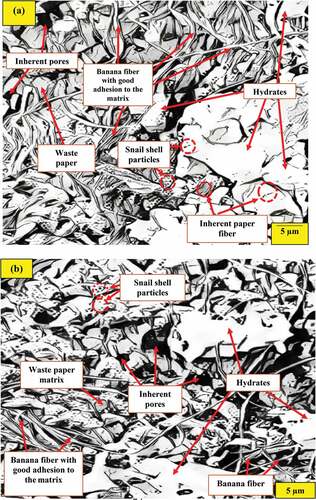
Figure 12. Microstructural image of composites (cured for 56 days) and containing (a) 1 wt.% TBF (EPI of 0.84, (b) 1.5 wt.% TBF (EPI of 0.85), (c) 2 wt % TBF (EPI of 0.87), and (d) 2.5 wt.% TBF (EPI of 0.9) cured for 56 days and possessed
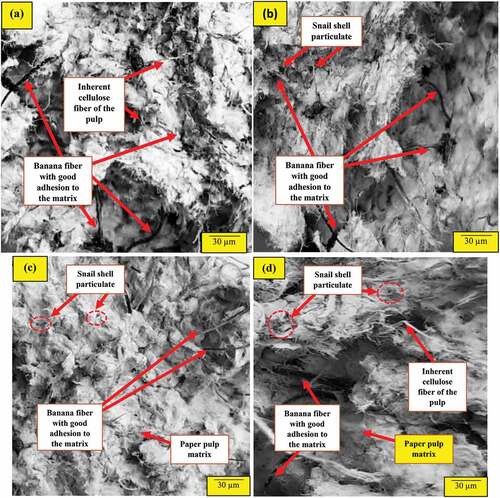
Figure 13. High magnification fluorescence (HMF) microstructural sketch images of composites (cured for 56 days) and containing 2.5 wt.% TBF (EPI of 0.9) cured for 56 days