Figures & data
Figure 1. Types of maintenance
Figure 2. Research methodology
Figure 3. Plant layout showing different departments
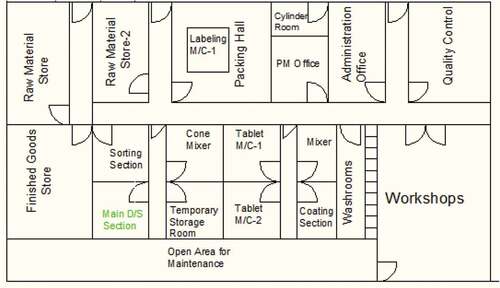
Figure 4. Process flowchart for the dry suspension section
Table 1. Summary of work done by various researches (Abdul Rasib et al., Citation2019; Aman et al., Citation2018; Braglia et al., Citation2008; Fam et al., Citation2018; Huang et al., Citation2003; Kapuyanyika & Suthar, Citation2018; Kumar et al., Citation2014; Palanisamy & Vino, Citation2013; Puvanasvaran et al., Citation2013; Samad & Hossain, Citation2012; Soltanali et al., Citation2018)
Table 2. Data for filling machine for four batches
Figure 5. Total production and wastes produced on filling machines
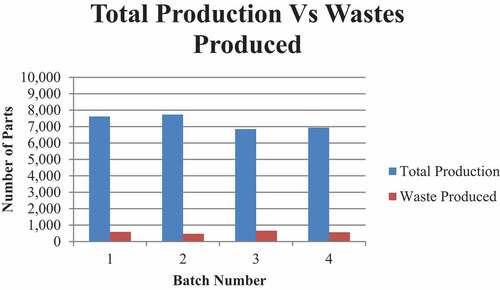
Figure 6. Performance measures for filling machines
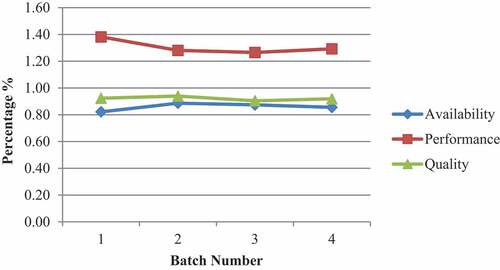
Table 3. Data for sealing machine for four batches
Figure 7. Total production and wastes produced on sealing machines
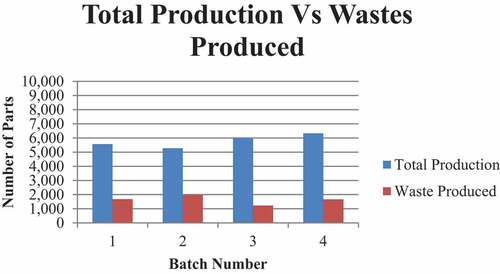
Figure 8. Performance measures for sealing machines
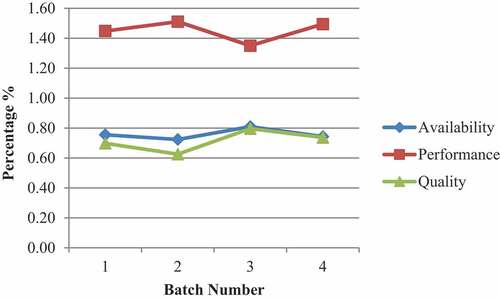
Table 4. Data for labeling machine for four batches
Figure 9. Total production and wastes produced on labeling machines
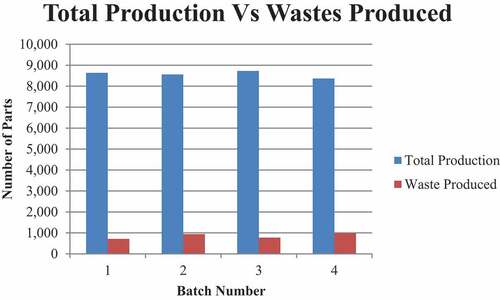
Figure 10. Performance measures for labeling machine
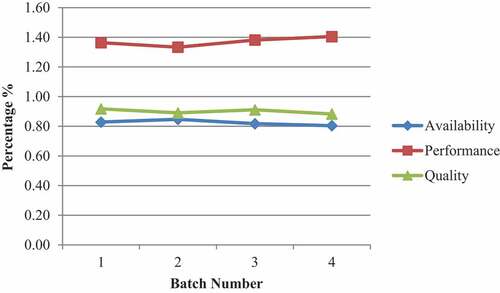
Table 5. Total loss from 12 batches on three machines
Figure 11. Losses resulted from 12 batches on the three machines
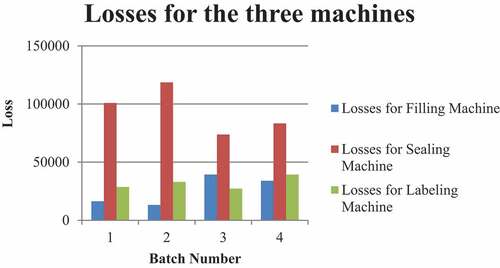
Figure 12. Effectiveness index for the dry suspension section
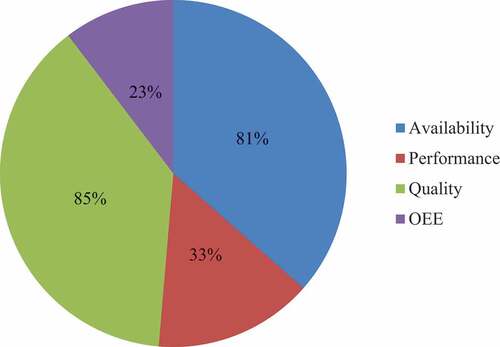
Figure 13. Effectiveness index for the three machines
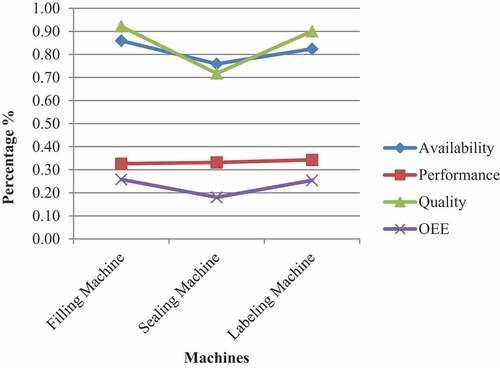
Table 6. Comparison of world class OEE and dry suspension OEE