Figures & data
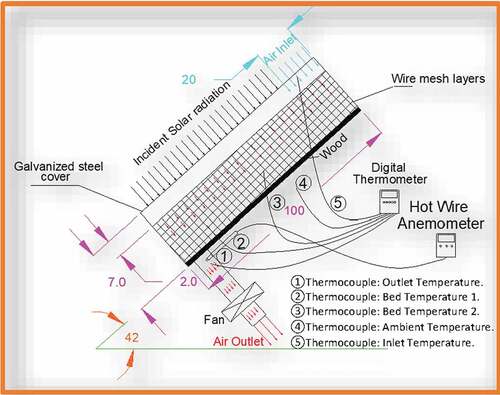
Figure 1. Assembly schematic of the unglazed solar collector (all dimensions in cm)
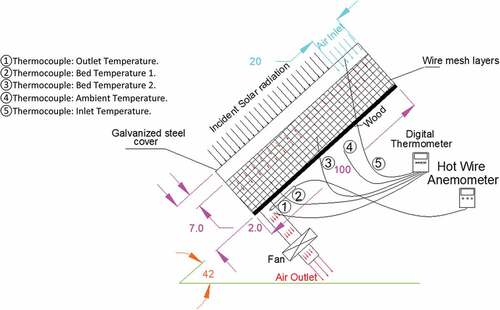
Table 1. The description of the equipment used during the work
Figure 2. Solar intensity versus time of the day for UTC, during testing having, opening cover plate area of 0.2 m2
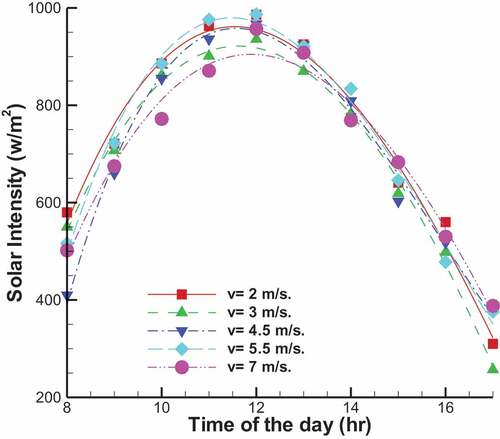
Figure 3. Inlet temperature versus time of the day for opening cover plate area of 0.2 m2
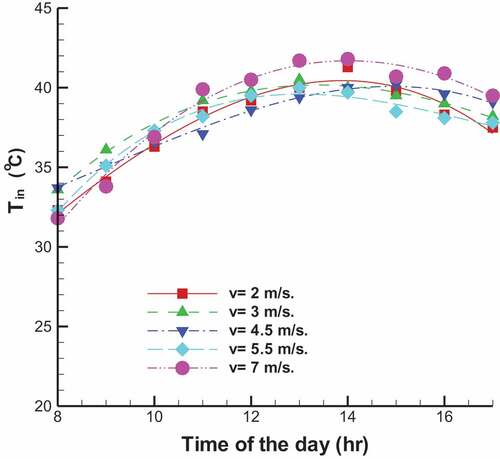
Table 2. Shows the uncertainty (ω), the average values of the inlet temperature, ambient temperature, and solar intensity values
Figure 4. Temperature difference versus time of the day at different for the collector opening perforated plate area of 0.2 m2
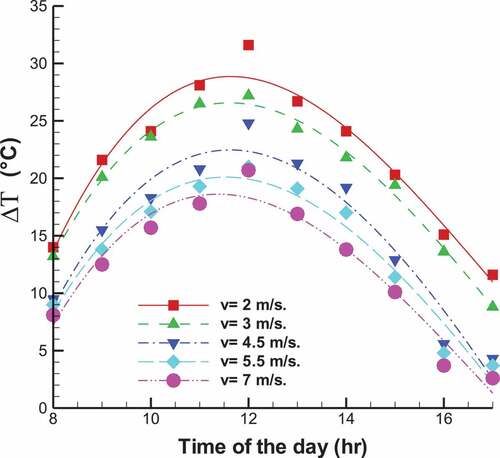
Figure 5. Variation of UTC instantaneous efficiencies with a temperature parameter
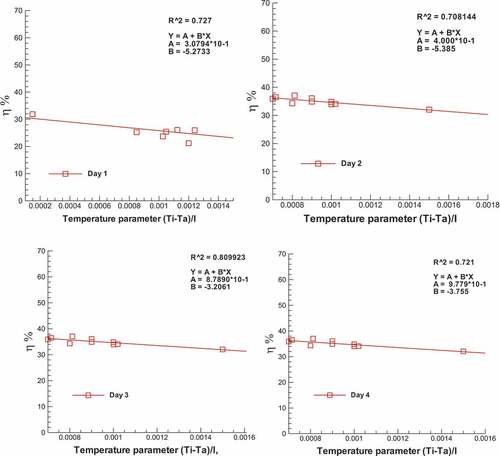
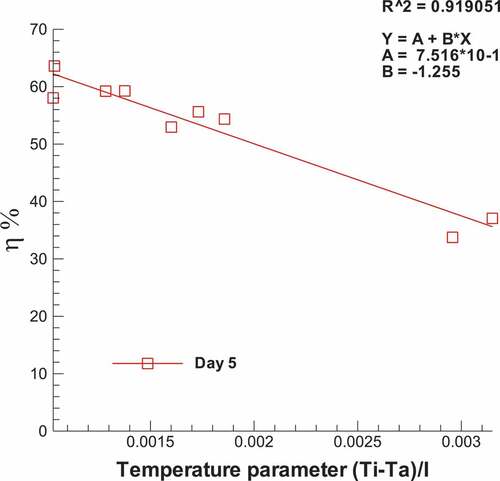
Figure 6. Experimented measured outlet temperature and predicted outlet air temperature
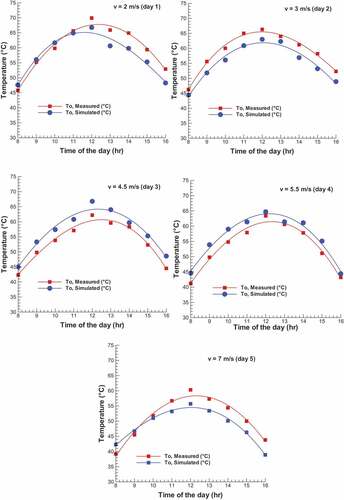
Figure 7. A variation of the collector efficiency of different air velocity for opening cover plate area of 0.2 m2
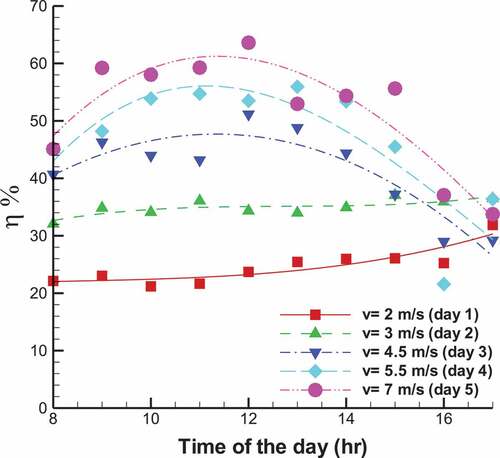
Table 3. The comparison between present work and previous works
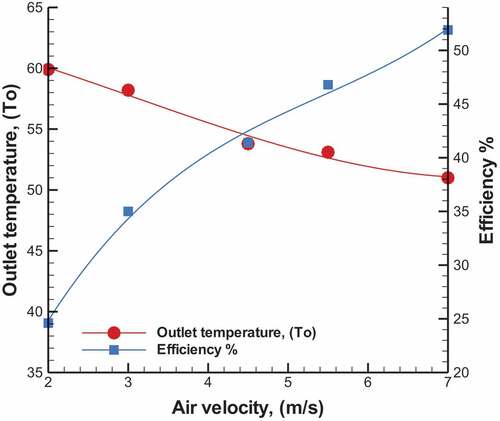
Figure 8. The relation of average outlet temperature, To with the average thermal efficiencies for the air velocity from 2 m/s to 7 m/s