Figures & data
Figure 1. Data collection in indoor environments (a) and (b) Some interior space in Chinese and international students’ rooms; (c) Ta and RH recording, (d) AC power and heating-triggered recording
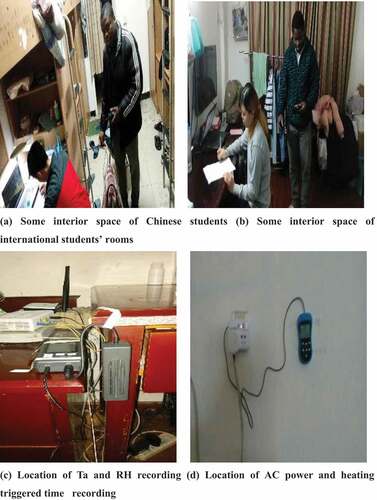
Table 1. Environmental parameters and instruments
Table 2. Demographic information of the study subjects
Table 3. Indoor environmental parameters in the students’ rooms
Figure 2. Indoor relative humidity distribution
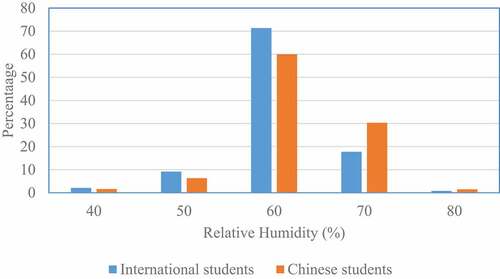
Table 4. Clothing insulation and metabolic rate of the subjects
Figure 3. Distribution of thermal sensation vote for international and Chinese students
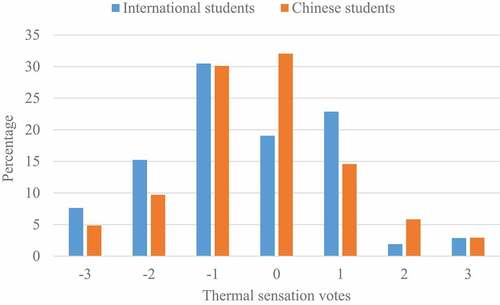
Figure 4. Thermal sensation vote for Chinese students and the three categories of international students
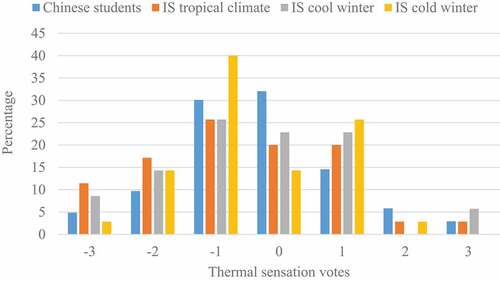
Figure 5. Mean thermal sensation votes and indoor air temperature for international and Chinese students
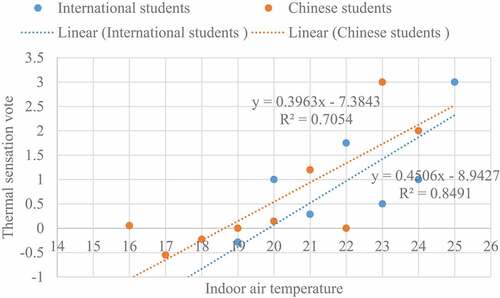
Figure 6. Frequency of occupants’ thermal preference for international and Chinese students
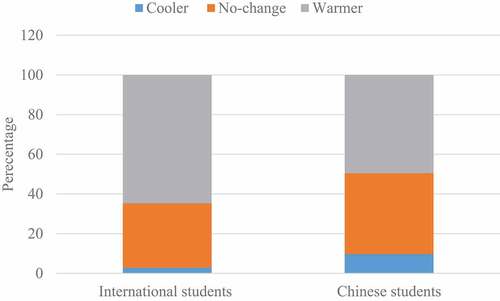
Figure 7. Frequency of occupants’ thermal preference for Chinese students and the three categories of international students
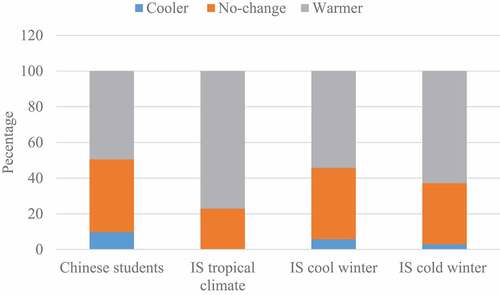
Figure 8. Relationship between humidity sensation and relative humidity
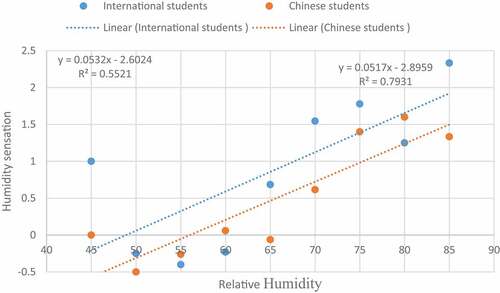
Figure 9. Humidity sensation votes distribution and its corresponding relative humidity and indoor air temperature for international and Chinese students
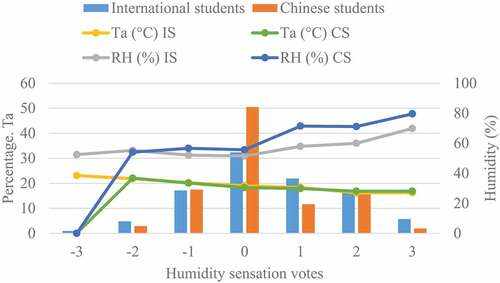
Figure 10. Occupants’ humidity preference for international and Chinese students
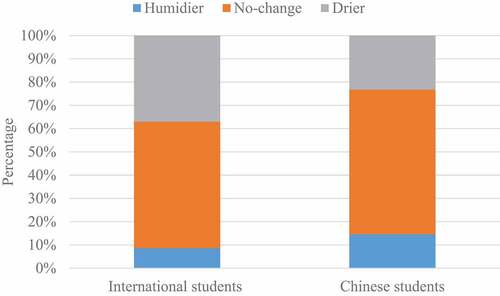
Figure 11. Occupants’ humidity preference for Chinese students and the three categories of international students
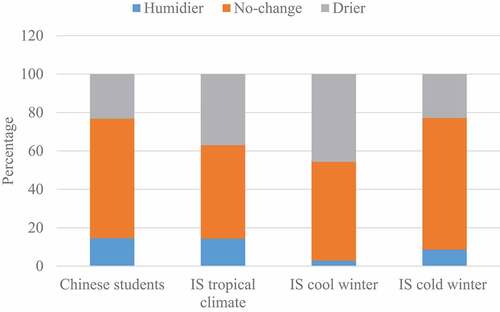
Figure 12. Proportion of thermal acceptability for international and Chinese students
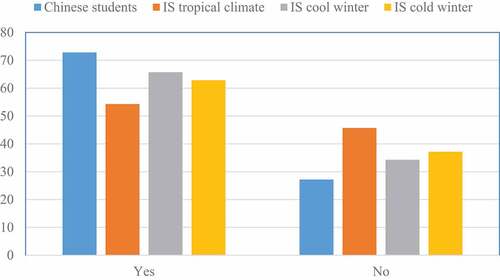
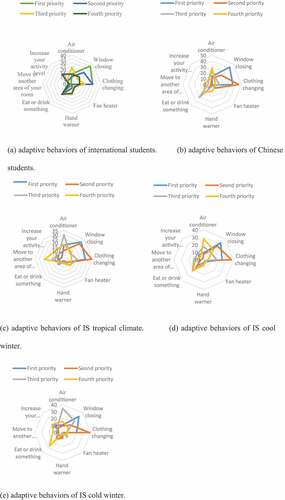
Figure 13. Occupants’ behavioral adjustments for all international and Chinese students and the three categories of international students