Figures & data
Figure 1. Frequency Distribution for Faults in Distribution Network
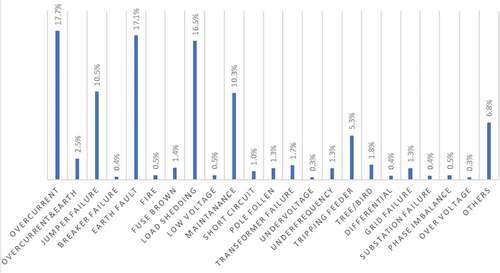
Figure 2. Time Taken to Repair Faults
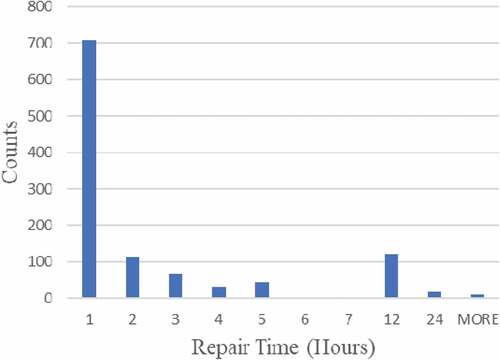
Figure 3. Counts for Planned and Unplanned Faults with their Restoration Time
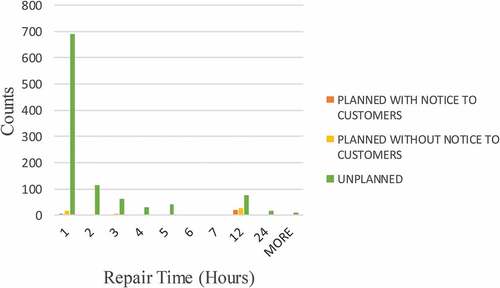
Figure 4. Load Profile
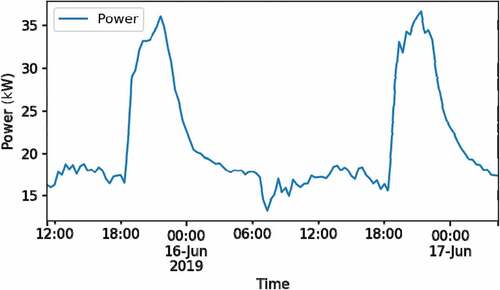
Figure 5. Proposed Agent Architecture for FLSR
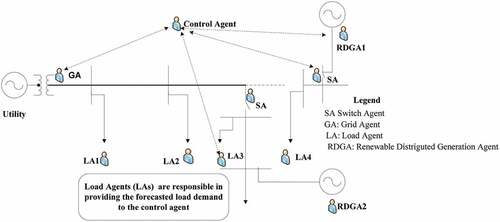
Figure 6. Agent Development GUI
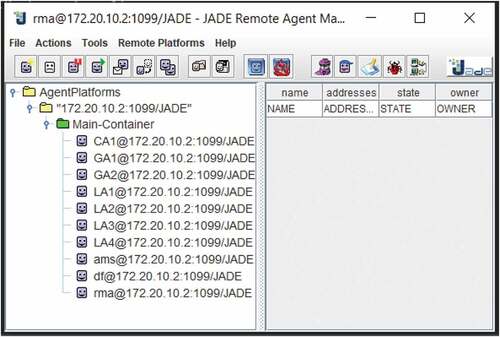
Figure 7. Flow of Information in the Distributed Control Algorithm
Figure 8. Agents Coordination in a Sniffer Agent
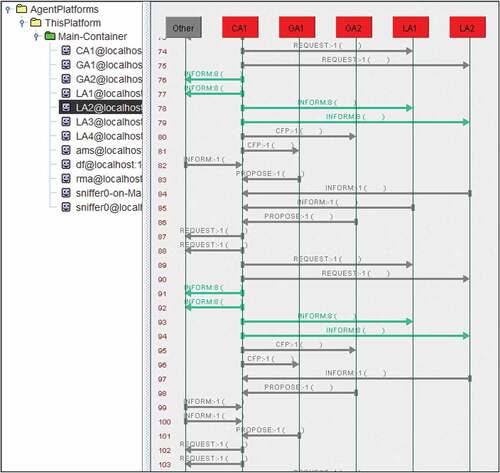
Figure 9. Distribution Network Topology with Switches
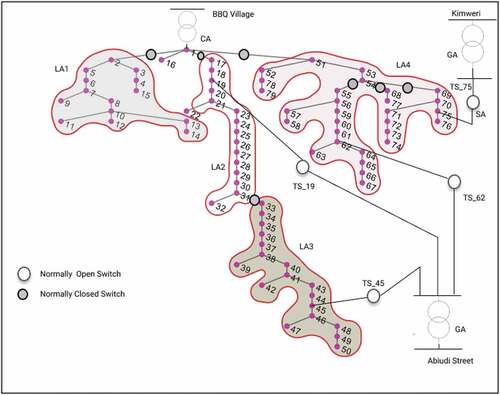
Figure 10. Fault Location for the Kimweri Site in Java Environment
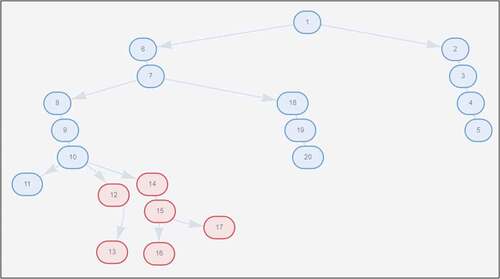
Table 1. Results on Optimal Load Shedding for Different Algorithms
Figure 11. Service Restoration with Load Shedding
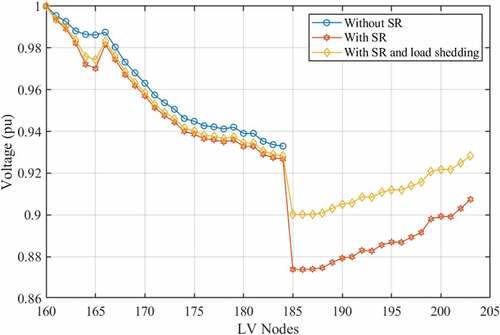
Figure 12. Improved Voltage Profile After Load Shedding during Service Restoration
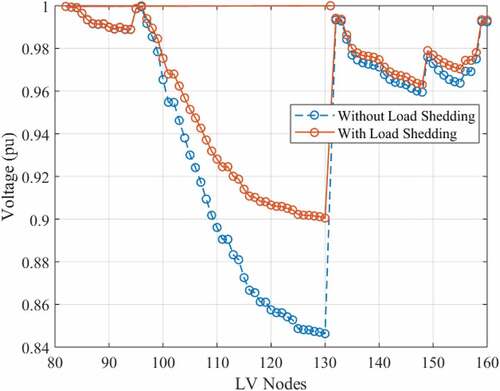
Figure 13. Network Optimization after Agent Negotiation
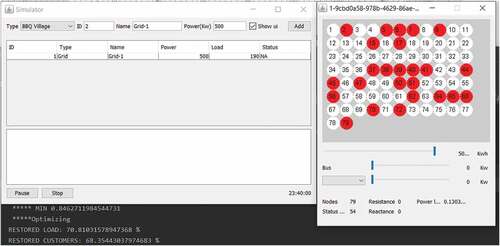
Table 2. Load Shedding due to the Use of Forecasted Demand and Peak Demand
Table 3. Shedding Buses with their Priority Levels
Figure 14. Voltage Profile after Reconfiguration during Off-Peak Hours
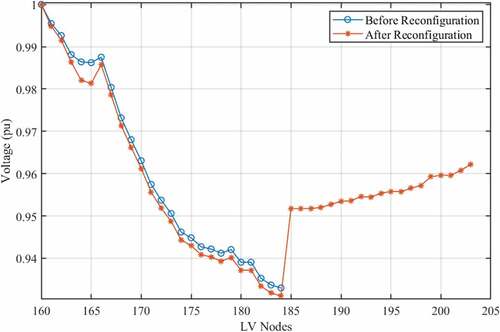
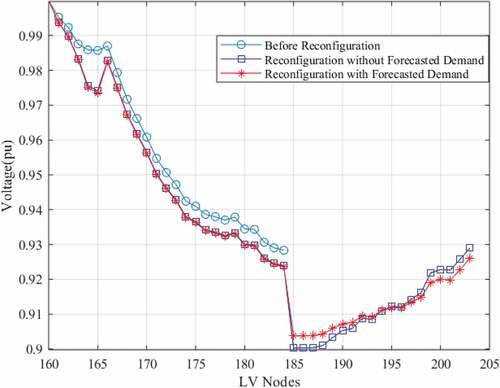
Figure 15. Comparison of Voltage Profile With and Without Forecasted Demand