
Figures & data
Figure 1. Participant inclusion flow diagram.
Figure 2. The EyeStat blink reflexometer labeled.
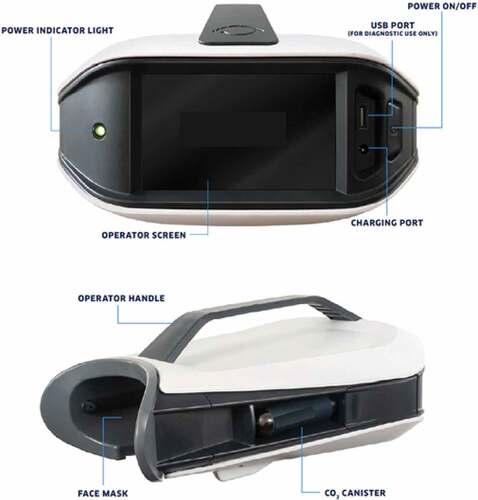
Table 1. Definitions of EyeStat parameters
Figure 3. A-E: Diagrammatic representation of parameters paired with eye photographs of a stimulated blink. A-D: Sequential stages of the stimulated blink reflex with paired eyelid location over time charting. E: Complete charting of a stimulated blink reflex with parameters labeled. The “threshold” line is considered the horizontal mid-pupil position. Time under threshold (not shown) measures the total time the eyelid remains below the mid-pupillary line (i.e. threshold).
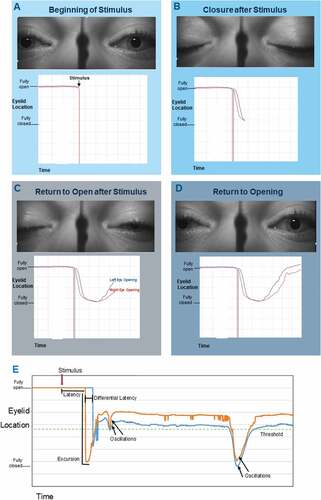
Table 2. Invalid test thresholdsa
Table 3. Study cohort demographics
Table 4. Normative data for latency by gender and age
Figure 4. Mean latency by age group. Group differences suggested the presence of two important groups, high school, and college. *Tukey HSD significant at p < 0.0005. Error bars represent 95% confidence interval.
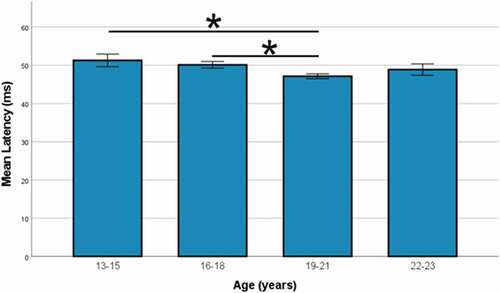
Table 5. Normative values of EyeStat parameters differing by gender and race
Table 6. Normative values of natural log of time under threshold by race