
Figures & data
Figure 1. DFE block diagram of MDM for FSO.
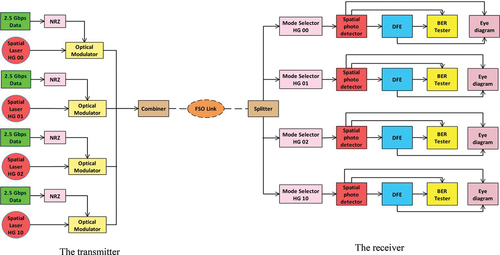
Table 1. DFE simulation parameters in MDM for the FSO system (Almogahed et al., Citation2017; Amphawan et al., Citation2015; Amphawan & Chaudharya, Citation2015)
Table 2. Attenuation values for different weather conditions (Almogahed et al., Citation2017; A. Malik & Singh, Citation2015)
Figure 2. MMSE-DFE block diagram.
Table 3. BER in clear weather prior to and following the various DFE schemes
Figure 3. BER comparison for every channel prior to the DFE and after various DFE schemes in clear weather.
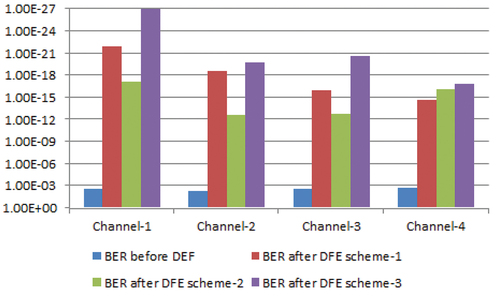
Table 4. DFEs taps coefficients from MMSE optimization in the case of four FFF taps and one FBF tap
Figure 4. Eye diagram at transmitter in the case of clear weather.
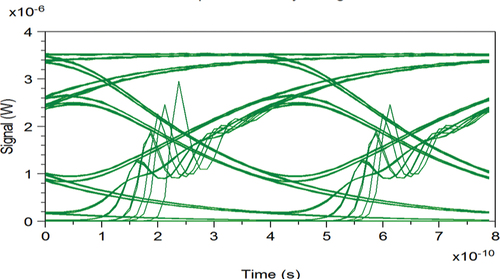
Table 5. Eye diagram for every channel prior to and following DFE in the case of four FFF taps and one FBF tap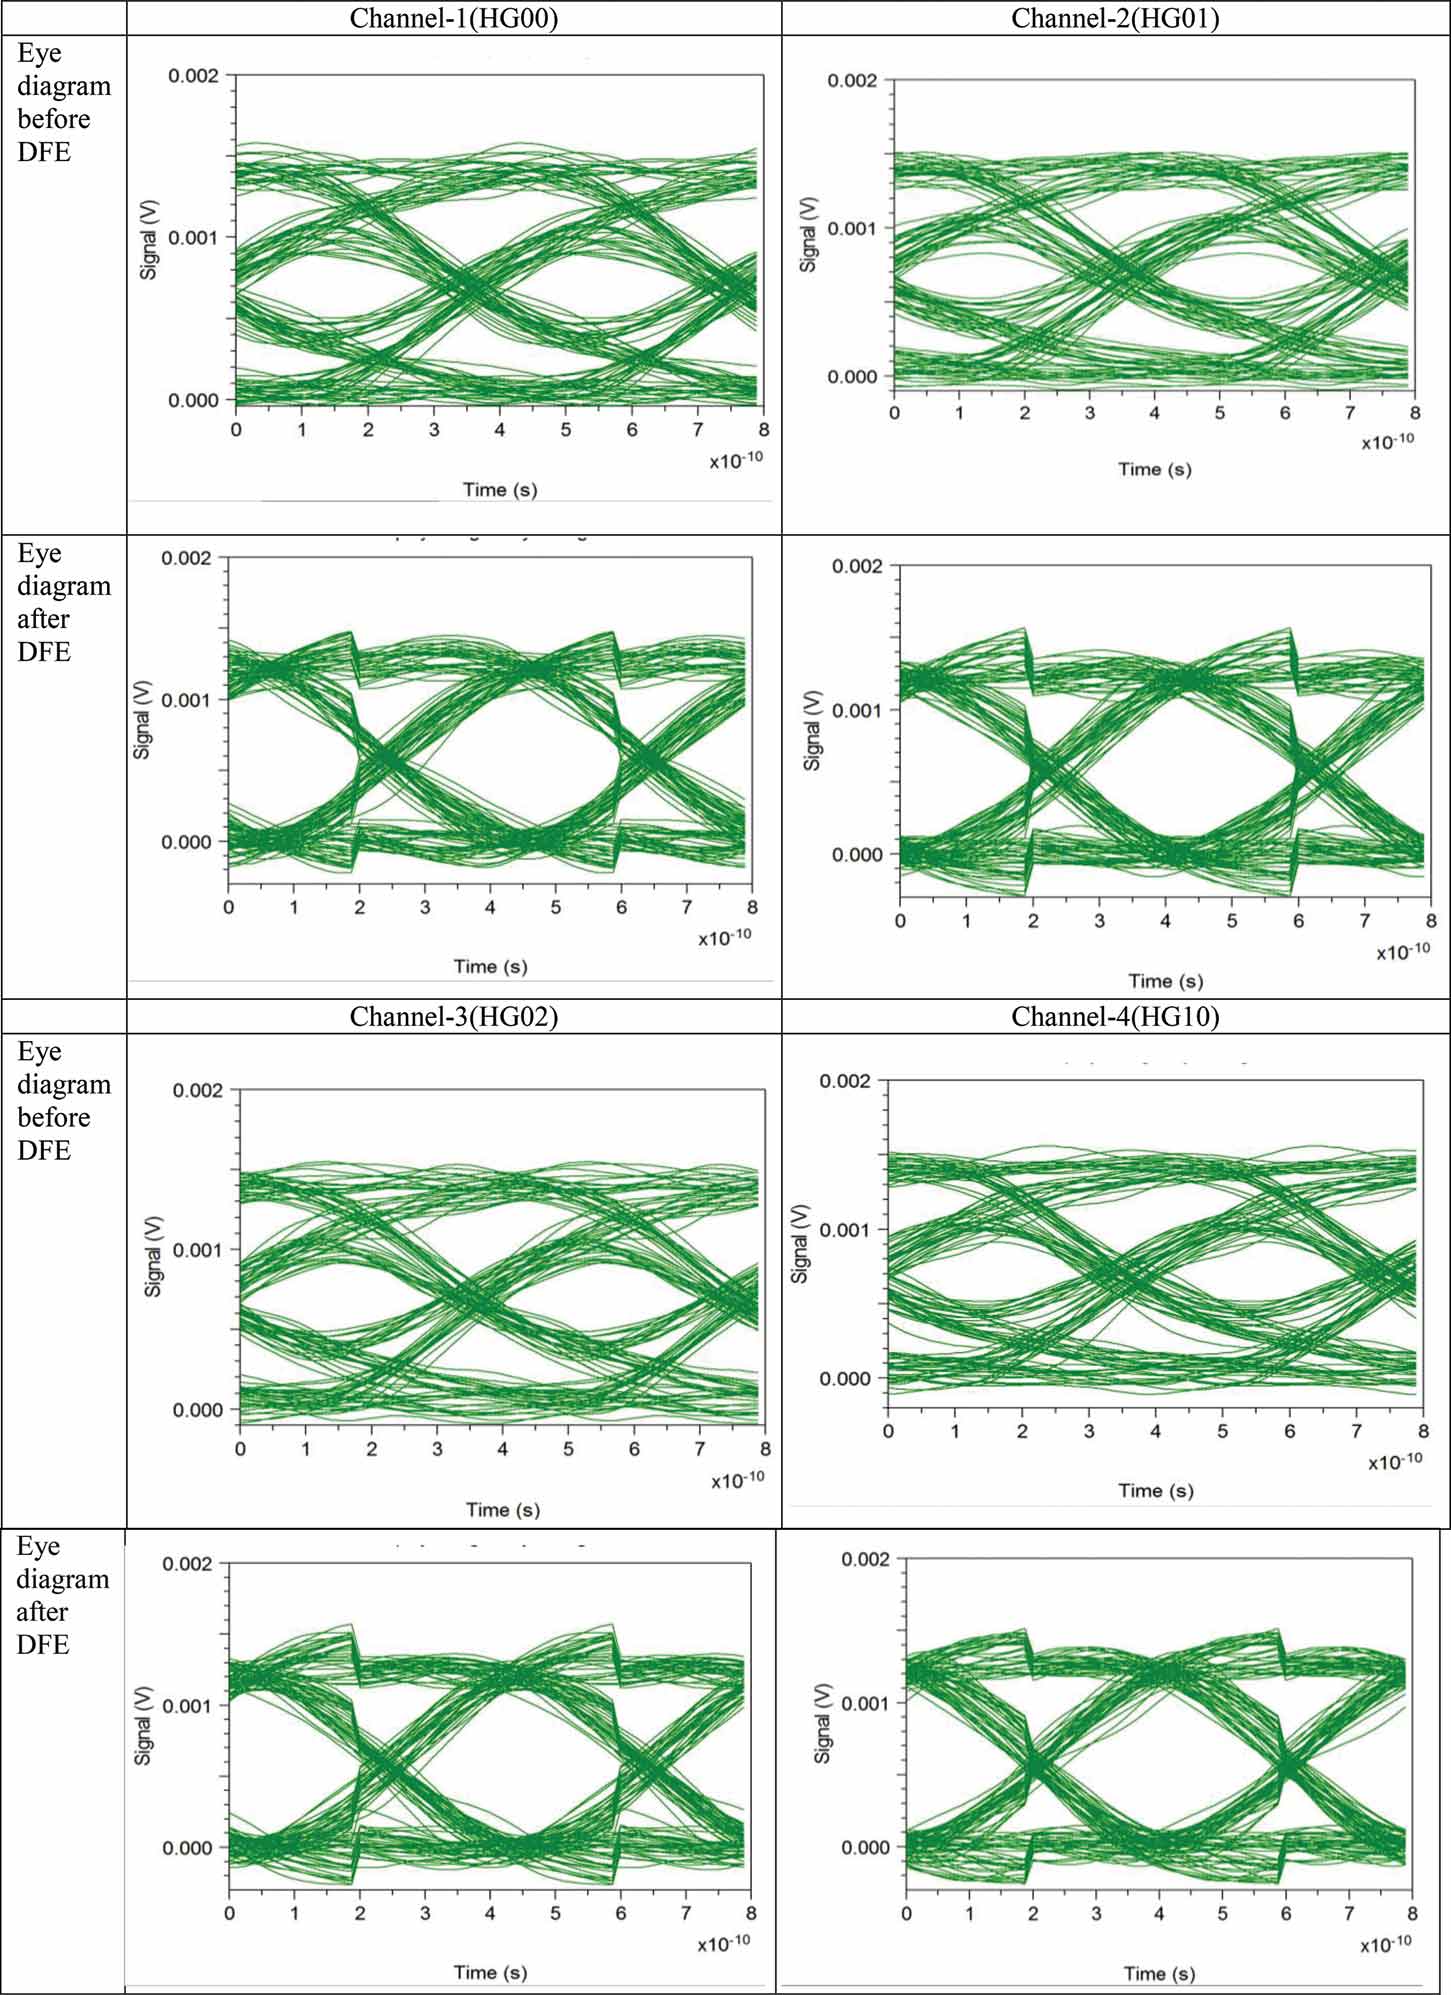
Table 6. BER prior to and following the various DFE schemes in medium haze
Figure 5. BER comparison for every channel prior to the DFE and after various DFE schemes in medium haze.
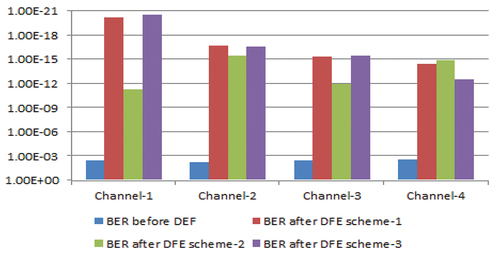
Table 7. DFEs taps coefficients from MMSE optimization in the case of 11 FFF taps and three FBF taps
Figure 6. Eye diagram at transmitter in the case of medium haze.
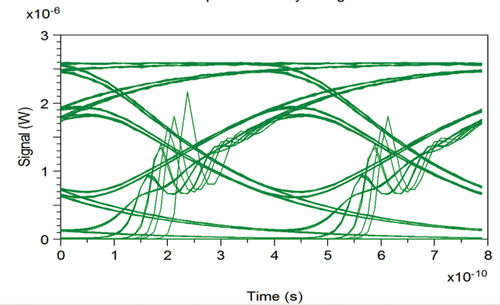
Table 8. Eye diagram for every channel prior to and following DFE in the case of three FFF taps and six FBF taps
Table 9. BER prior to and following the various dfe schemes in medium rain
Figure 7. BER comparison for every channel prior to the DFE and after various DFE schemes in medium rain.
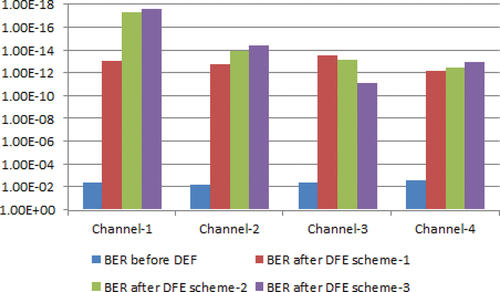
Table 10. DFEs taps coefficients from MMSE optimization in the case of seven FFF taps and four FBF taps
Figure 8. Eye diagram at transmitter in the case of medium rain.
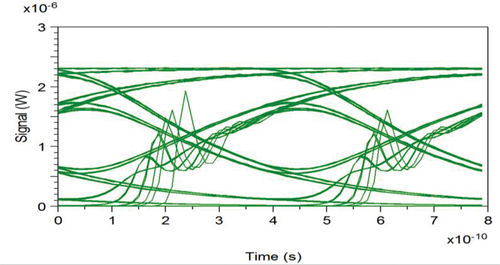
Table 11. Eye diagram for every channel prior to and following DFE in the case of seven FFF taps and four FBF taps
Table 12. BER prior to and following the various DFE schemes in medium fog
Figure 9. BER comparison for every channel prior to and following various DFE schemes in medium fog.
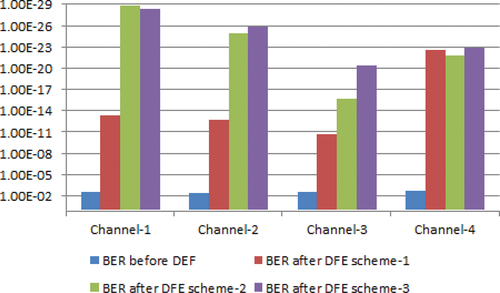
Table 13. DFEs taps coefficients from MMSE optimization in the case of five FFF taps and five FBF taps
Figure 10. Eye diagram at transmitter in the case of medium fog.
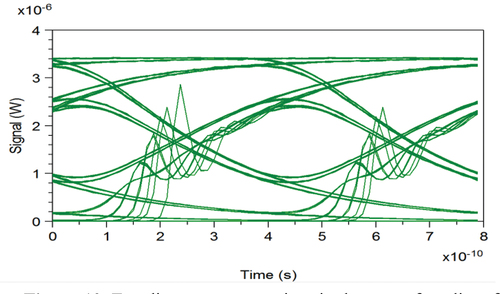
Table 14. The eye diagram for every channel prior to and following DFE in the case of five FFF taps and five FBF taps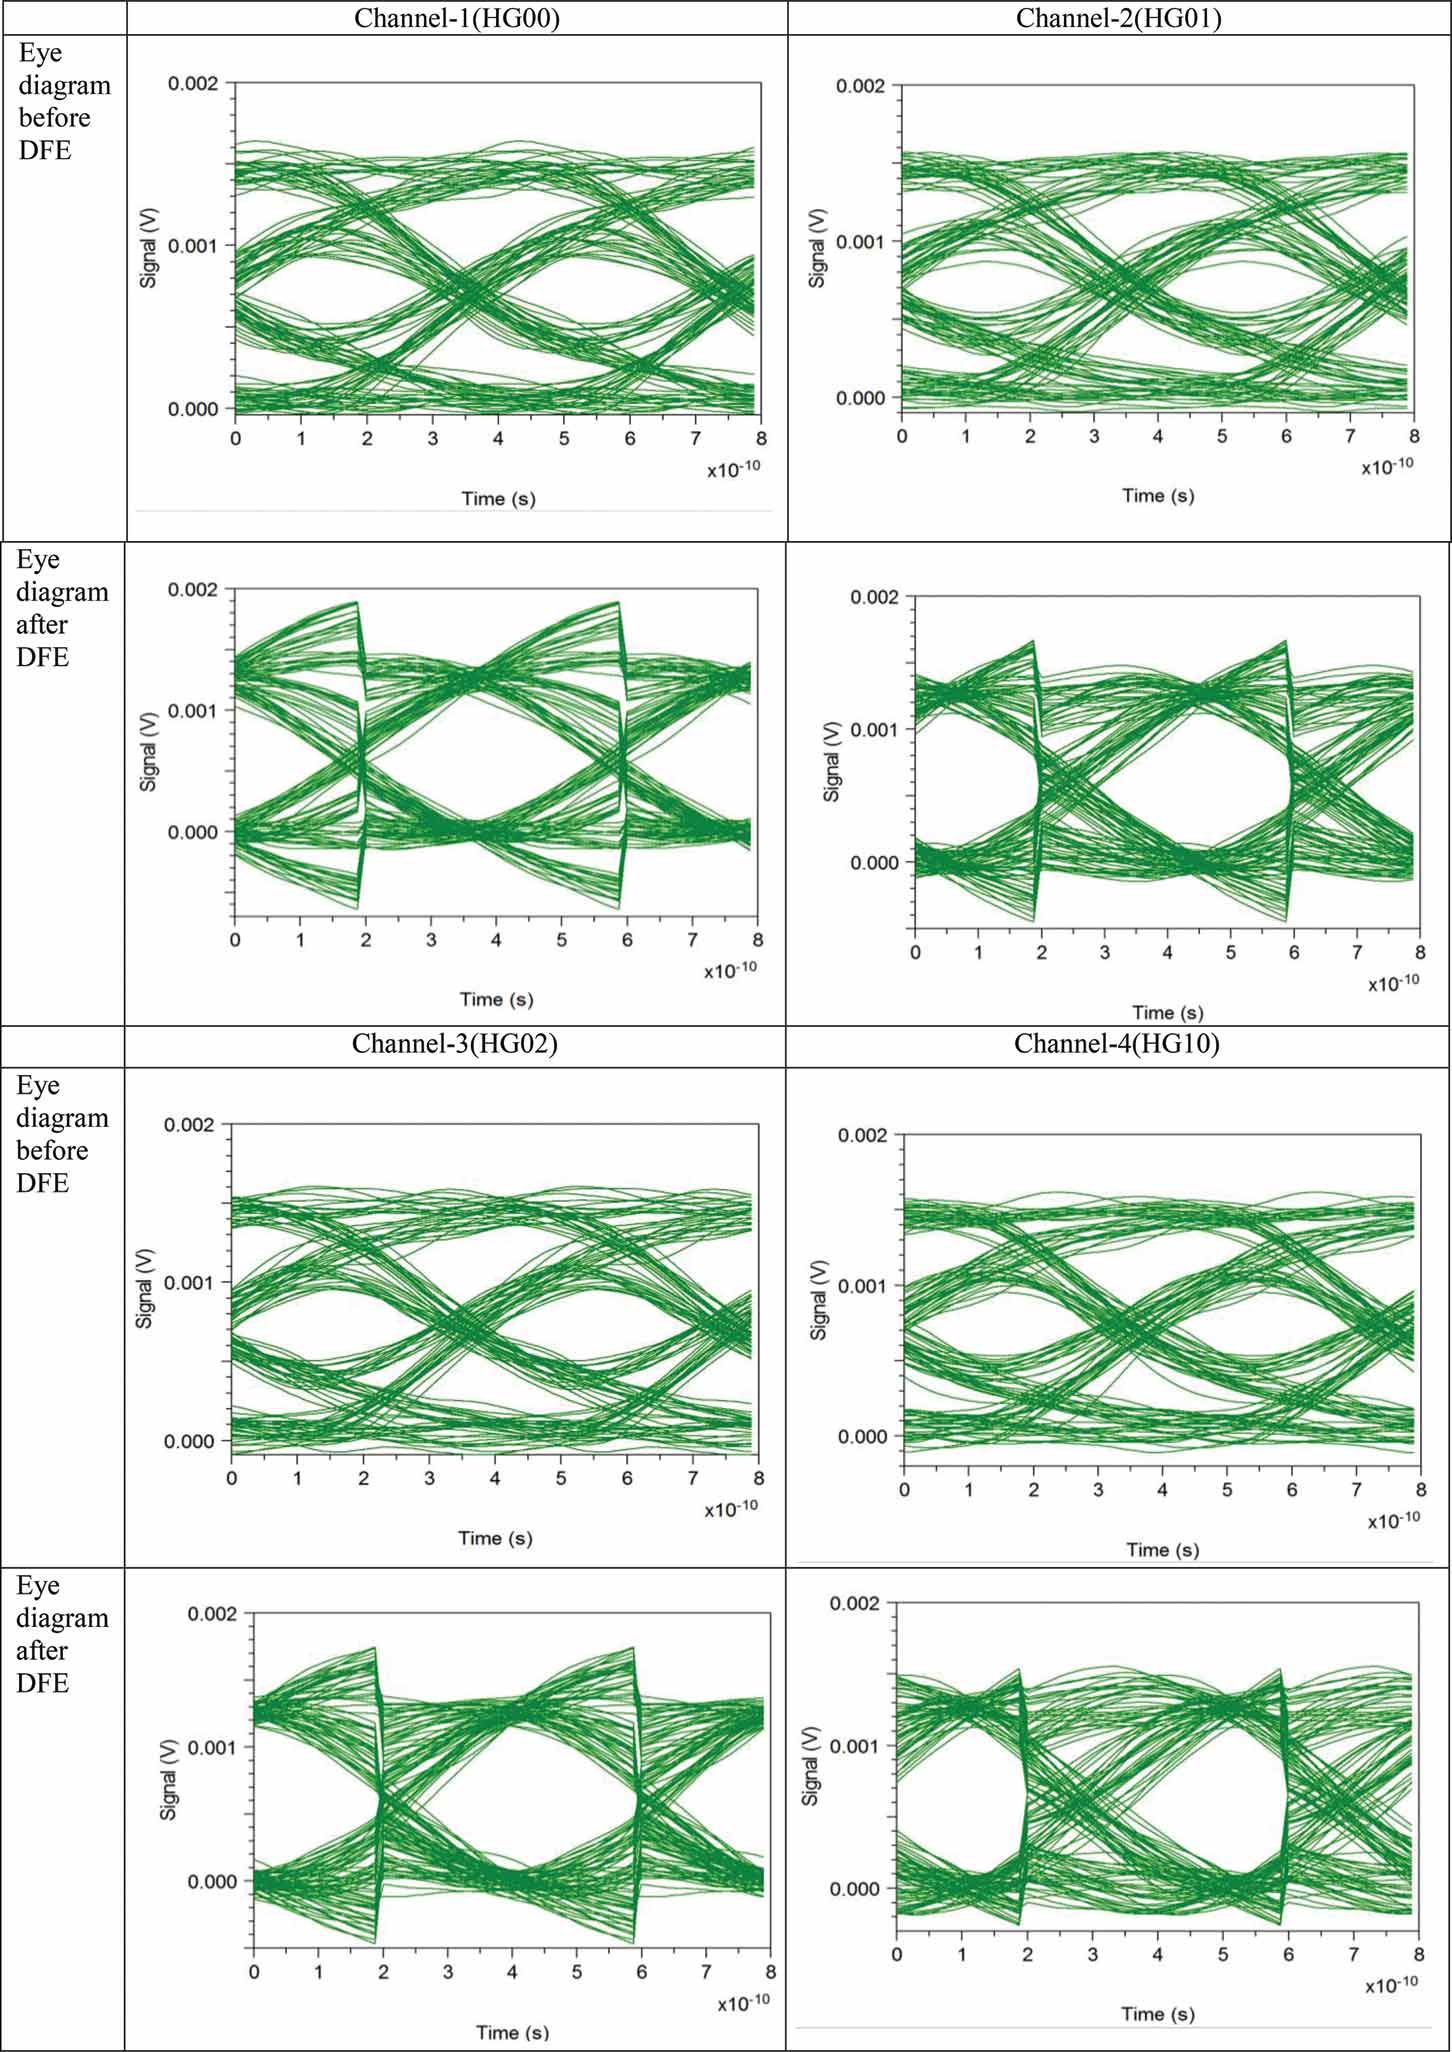
Table 15. Comparison performance of the DFE scheme in MDM for FSO system with previous MDM-FSO system