
Figures & data
Table 1. The parameters that affect the spread of COVID-19 in Jordan.
Figure 1. The distribution of the survey participants by the geographic location.
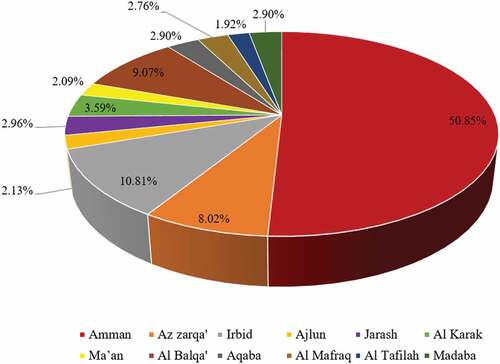
Table 2. The questions related to the 6 parameters of the social characteristics category.
Figure 2. The schematic architecture of the NARX neural network.
Figure 3. The flowchart of the NARX model development.
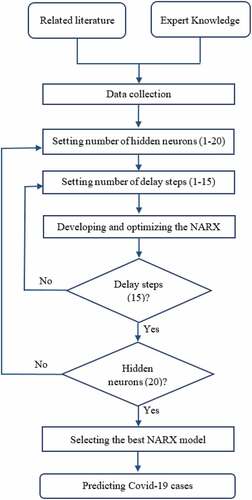
Figure 4. The prediction performance of the NARX model: (a) Training set, (b) Validation set, and (c) Testing set.
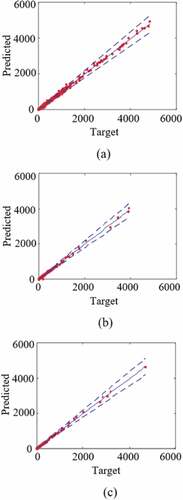
Figure 5. The time-series response for the numbers of actual and predicted COVID-19 cases in Jordan using the NARX model.
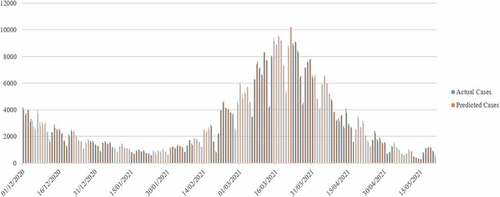
Figure 6. The predictive performance for the new data using the NARX.
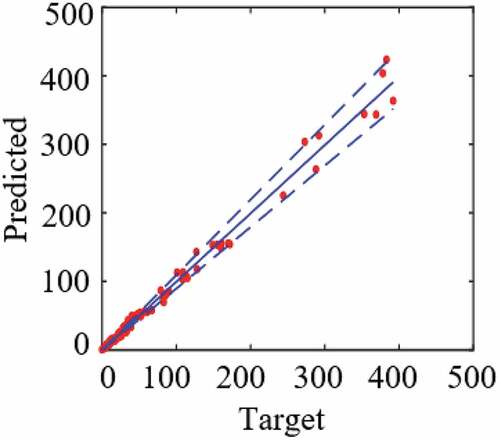
Figure 7. An example of the actual (A) and the predicted (P) numbers of COVID-19 cases for the 12 governorates in Jordan on May 24th of 2021.
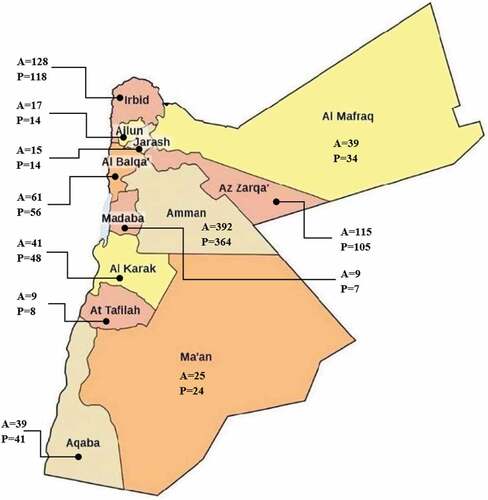
Figure 8. The time-series response for the numbers of actual and predicted COVID-19 cases in Jordan using the ARIMA model.
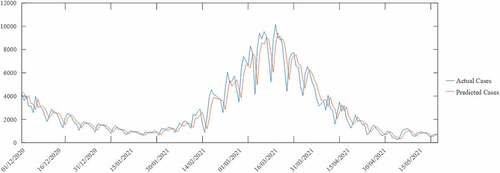
Figure 9. The time-series response for the numbers of actual and predicted COVID-19 cases in Jordan using the LSTM model.
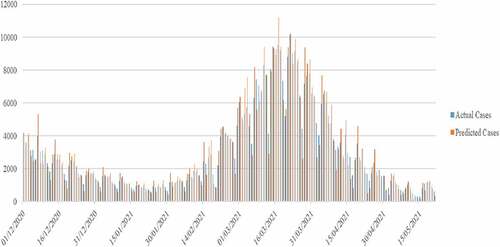
Table 3. The overall predictive performance of the models