
Figures & data
Figure 1. Flowchart of the development process.
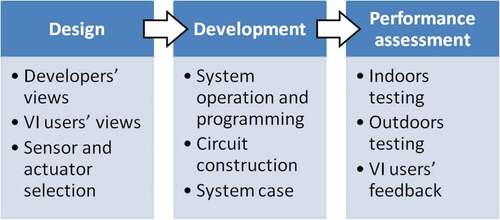
Table 1. Survey 1—Needs assessment
Figure 2. Arrangement of the sensors used for the proposed system. Gray-shaded areas represent the sensors’ sensing fields.
Figure 3. Flowchart of the proposed system operation. Thresholds for detecting obstacles at the head, trunk and foot level are denoted as “thr_H”, “thr_T”, and “thr_F”, respectively. The threshold for drop-off detection is denoted as “thr_D”.
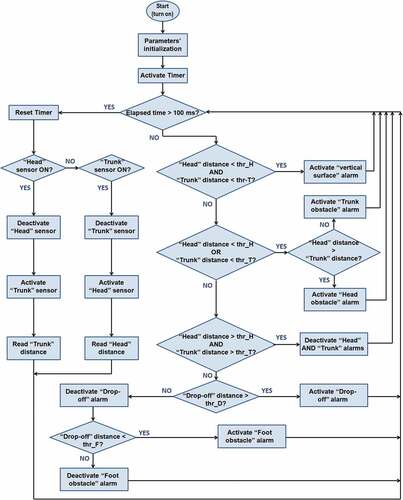
Table 2. Threshold values for obstacle detection and identification
Figure 4. Electric diagram of the circuit for the proposed system.
Figure 5. The external appearance of the proposed system. Values are expressed in centimeters.
Figure 6. Scenarios for the first (a) and the second navigation test (b). The empty and filled circles denote the starting and ending points, respectively. Distances between obstacles were more than 5 meters.
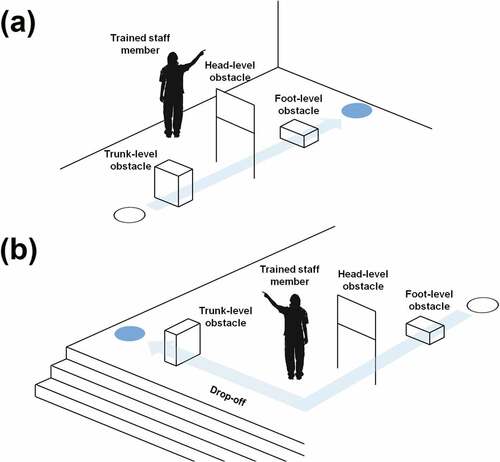
Table 3. Survey 2—Performance assessment
Figure 7. Front view (a) and back view (b) of the proposed system.
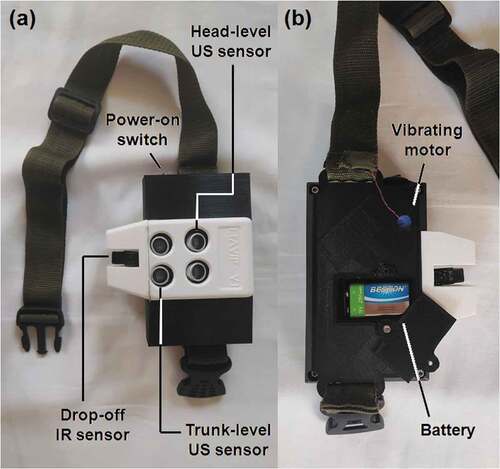
Table 4. Results of the first survey: VI users’ opinions (n = 15)
Table 5. Detection results for the first test. The “X” denotes successful detection
Table 6. Detection results for the second test. The “X” denotes successful detection
Table 7. Results of the second survey: VI users’ opinions (n = 12)
Table 8. Our system compared with similar studies (NR: not reported)