
Figures & data
Figure 1. Flow chart of research method process.
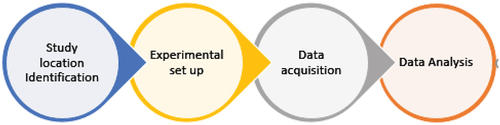
Figure 2. (a) Map of Nigeria showing the selected locations. (b) Kaolin mining field showing the sampling locations.
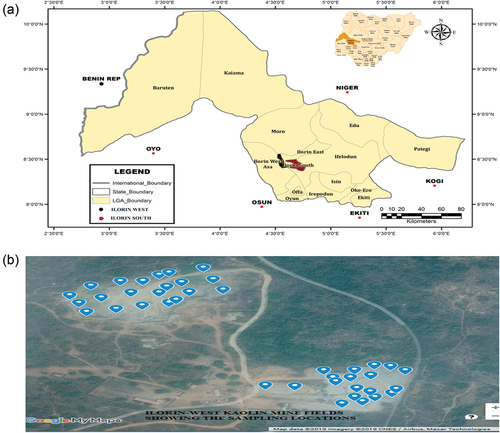
Figure 3. Super SPEC RS-125 gamma spectrometer.
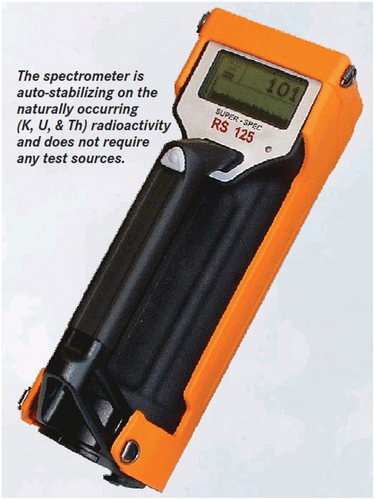
Table 1. In-situ mean activity concentrations of 40K, 238U, 232Th and the absorbed dose rates from Kaolin mining field in Ilorin-west
Table 2. In-situ mean activity concentrations of 40K, 238U, 232Th and the absorbed dose rates from Kaolin mining field in Ilorin-south
Table 3. Comparison of the mean activity concentration and dose rate with other studies
Table 4. Pearson’s correlation matrix showing the relationship between the measured radionuclides and the gamma dose rate at Kaolin mining field in Ilorin-west
Table 5. Pearson’s correlation matrix showing the relationship between the measured radionuclides and the gamma dose rate at Kaolin mining field in Ilorin-south
Figure 4. Summary of the estimated radiological parameters at Ilorin-west.
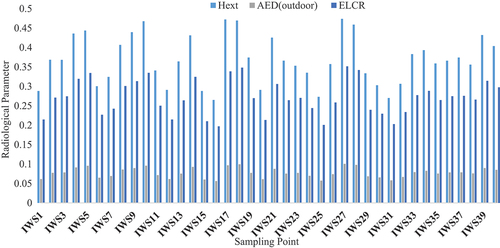
Figure 5. Summary of the estimated radiological parameters (RIP) at Ilorin-south.
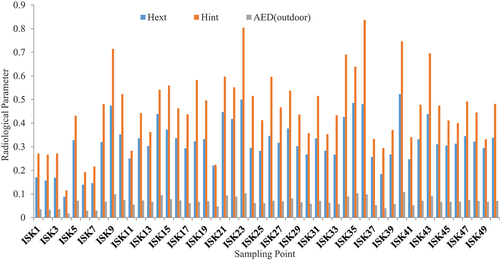
Table 6. Summary of the estimated DR, AED, Hext, Hintand Raeq for the measured activity concentrations at Ilorin-west
Table 7. Summary of the estimated DR, AED, Hext, Hint and Raeq for the measured activity concentrations at Ilorin-south