
Figures & data
Figure 1. Infiltration and geofluid flow through saturated and unsaturated zones of a slope (Forrester, Citation1996; González de Vallejo & Ferrer, Citation2011; Nooralddin, Citation2021).
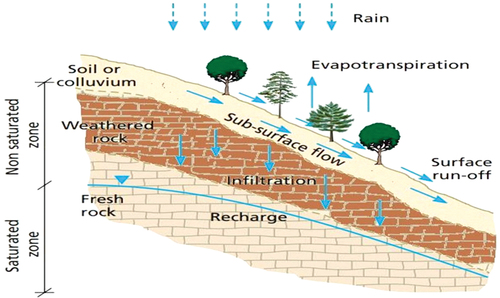
Figure 2. Effect of infiltration and soil particle arrangement in water table in a slope (Forrester, Citation1996; González de Vallejo & Ferrer, Citation2011; Nooralddin, Citation2021).
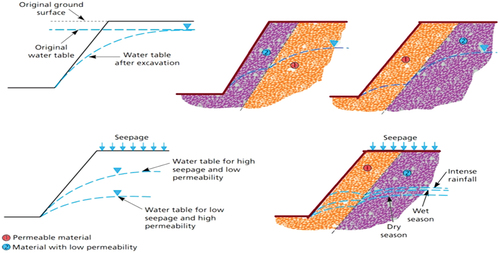
Figure 3. a) Water pressure triangle for a discontinuous single plane on a slope. b) Pressure triangles through tension cracks at the slope head (U and V are forces due to water on the sliding plane and on the tension crack, respectively; Forrester, Citation1996; González de Vallejo & Ferrer, Citation2011; Nooralddin, Citation2021)
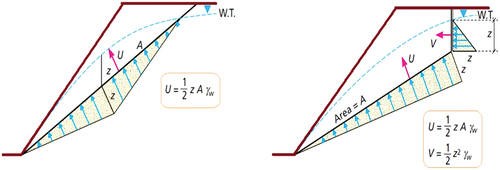
Figure 4. Schematic arrangement of an SPH convolution; result function and the process of computation (Chen & Qiu, Citation2011; Mocz, Citation2011; Nonoyama et al., Citation2015).
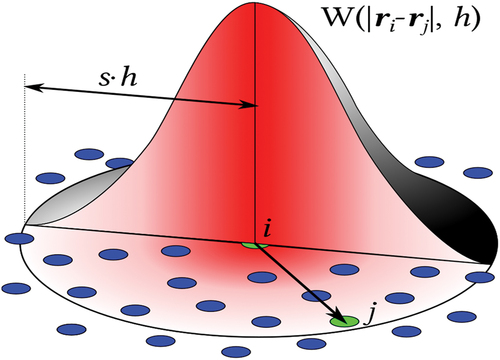
Figure 5. Application of kernel function (Gaussian-like curves) in reconstructing a continuous function in SPH (Chen & Qiu, Citation2011; Mocz, Citation2011; Nonoyama et al., Citation2015).
Figure 6. Case study area-Luxembourg.
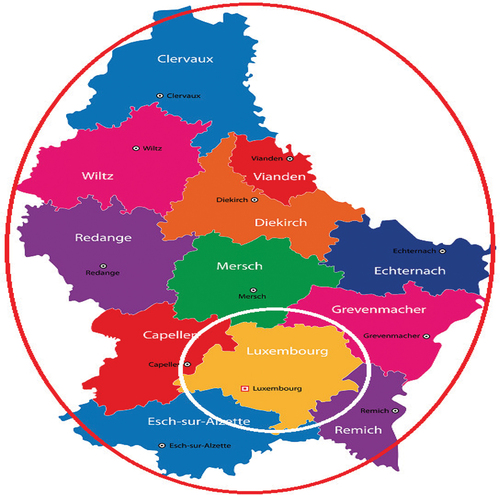
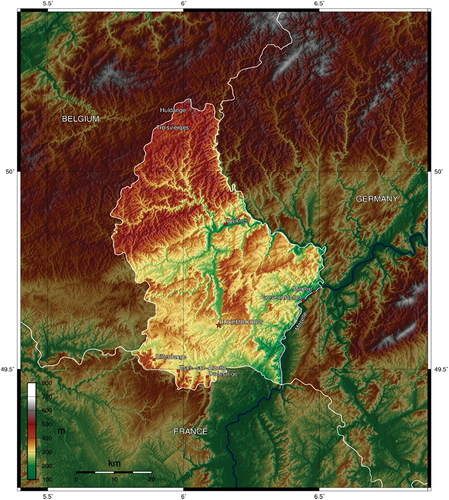
Figure 7. Geographical information of the case study area-Luxembourg.
Data Availability Statement
The underlying data supporting the results of this study has been reported in the manuscript.