
Figures & data
Figure 1. A cabinet-tray dryer for the drying of okra slices.
Table 1. Experimental range and levels of the variables using RCCD for okra drying
Figure 2. Plots for (a) PMC (b) TPC (c) PTC (d) CHC results obtained from different experimental runs carried out at different drying process parameters (AV, DT, RH and DRT).
Table 2. Model coefficient estimate and ANOVA for the dried okra’s PMC, PTC, CHC and TPC
Figure 3. Three dimensional (3D) response surface plot indicating the interaction effect of RH and AV on (a) PMC (b) TPC (c) PTC (d) CHC during the okra drying process.
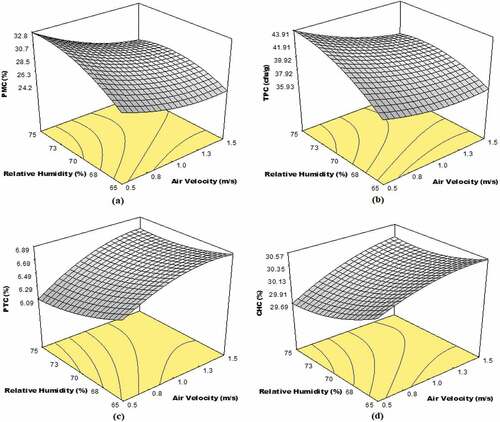
Figure 4. Three dimensional (3D) response surface plot indicating the interaction effect of DT and AV on: (a) PMC (b) TPC (c) PTC (d) CHC during okra drying process.
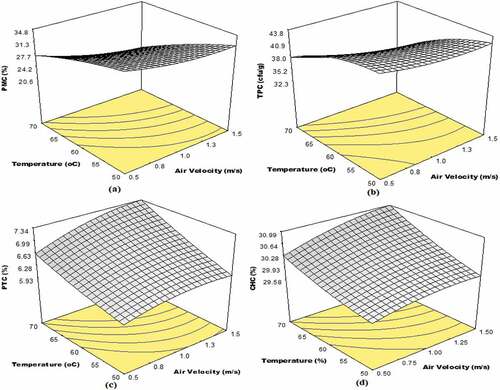
Figure 5. Three dimensional (3D) response surface plot indicating the interaction effect of DRT and AV on: (a) PMC (b) TPC (c) PTC (d) CHC during okra drying process.
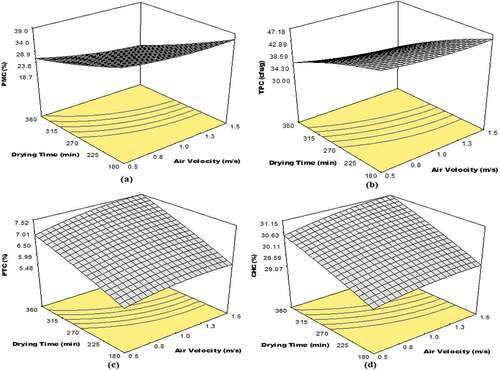
Figure 6. Three dimensional (3D) response surface plot indicating the interaction effect of DRT and RH on: (a) PMC (b) TPC (c) PTC (d) CHC during the okra drying process.
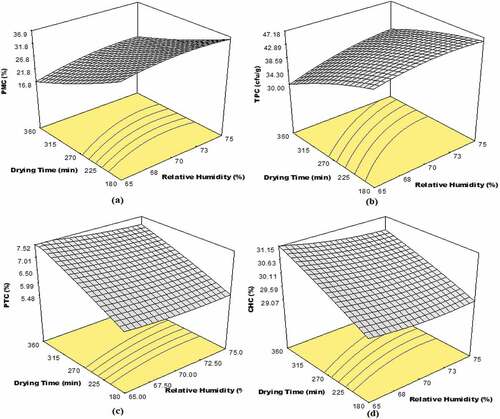
Figure 7. Three dimensional (3D) response surface plot indicating the interaction effect of DRT and DT on: (a) PMC, (b) TPC, (c) PTC and (d) CHC during okra drying process.
Table 3. Optimization and verification of PMC, TPC, PTC and CHC