
Figures & data
Figure 1. Internal structure of the cervix.
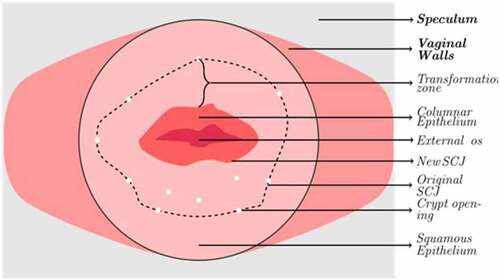
Table 1. Cervical cancer various stages
Table 2. Various researches that diagnose cervical cancer using machine learning approaches
Table 3. Description of the dataset
Figure 2. (a) Bar graph showing the percentage of null values in the dataset (b) The percentage of biopsy positive and biopsy negative results.
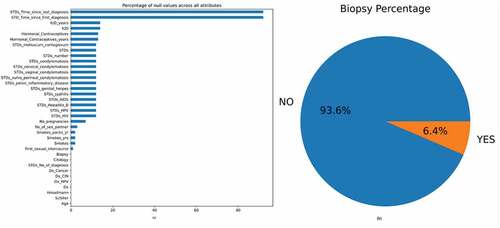
Figure 3. Count plots and density plots (a) The number of patients who smoke (b) The number of patients who use hormonal contraceptive (c) The number of patients who use intra-uterine devices (d) The number of patients who have sexually transmitted diseases (e) Patient age distribution (f) The number of pregnancies (g) The number of sexual partners.
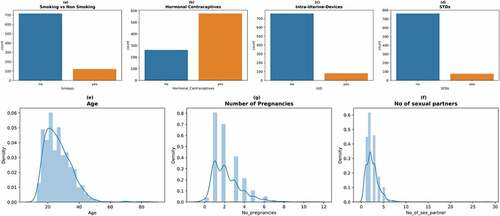
Figure 4. Multivariate analysis using box plots.
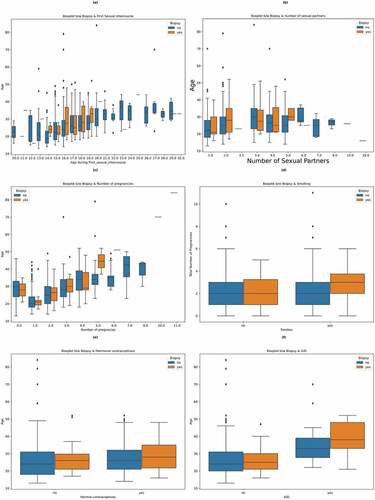
Figure 5. The impact of STD’s on the biopsy result.
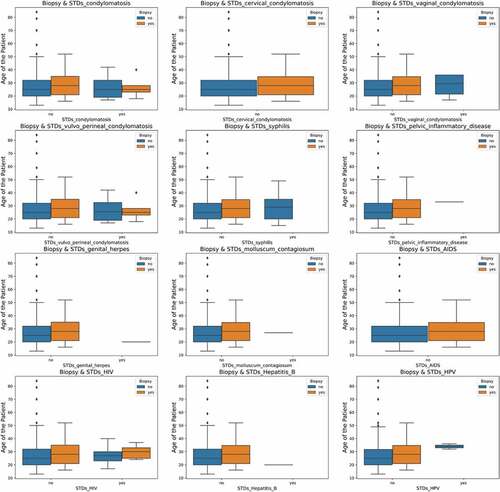
Figure 6. The presence of outliers in data. (a) Outliers before IQR treatment (b) After IQR treatment (Outliers removed).
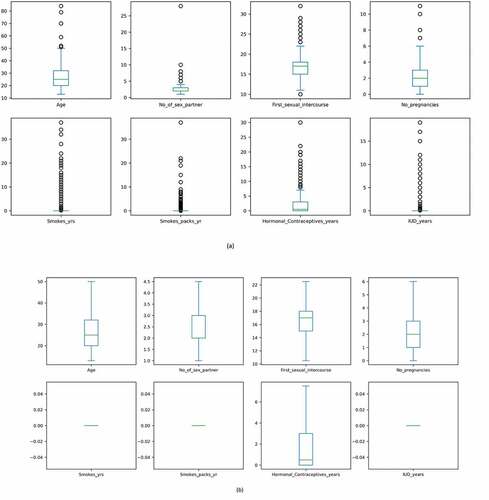
Figure 7. Mutual Information which describes the relationship among various attributes which diagnose cervical cancer.
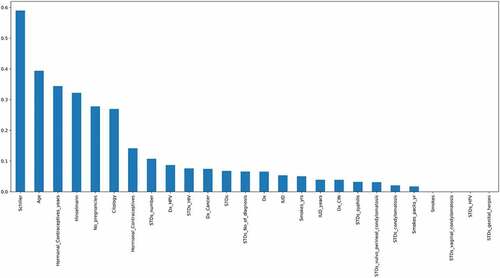
Figure 8. Pearson’s correlation heatmap which describes the relationship among various attributes which diagnose cervical cancer.
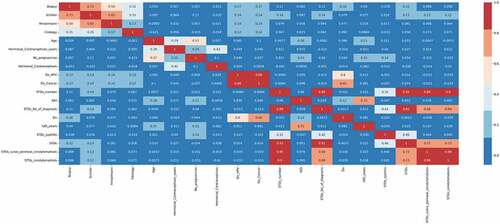
Figure 9. Biopsy results before and after balancing. (a) Initial unbalanced data (b) Balanced data after using Borderline-SMOTE.
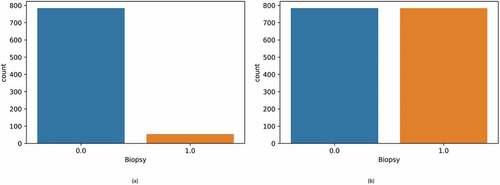
Figure 10. Various steps followed to predict biopsy results using machine learning.
Figure 11. Custom stacking architecture to predict cervical cancer biopsy results.
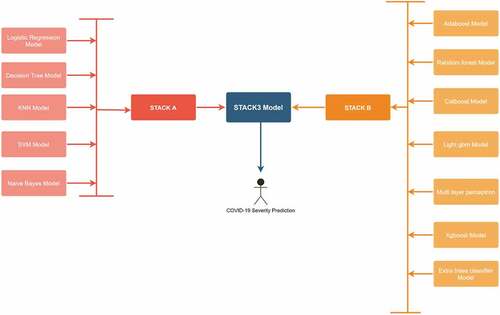
Table 4. Performance evaluation of classifiers without using feature selection and borderline-SMOTE (Unbalanced dataset)
Figure 12. ROC curves obtained by the classifiers. (a) Logistic regression (b) Decision tree (c) KNN (d) SVM (e) Naïve Bayes (f) STACK A.
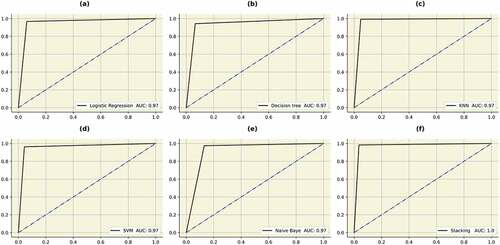
Figure 13. Precision-recall curves of the initial set of classifiers.
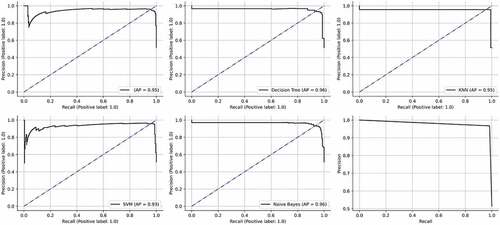
Table 5. Performance evaluation of the initial set of classifiers after data balancing and hyperparameter tuning
Figure 14. AUC’s of the bagging, boosting and stacking classifiers. (a) Random forest (b) MLP (c) Adaboost (d) Catboost (e) Lightgbm (f) Xgboost (g) Extratrees (h)STACKB (i) STACKC.
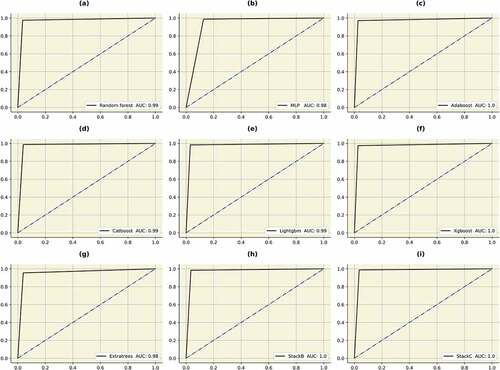
Figure 15. Precision-recall curves of the bagging, boosting and stacking classifiers.
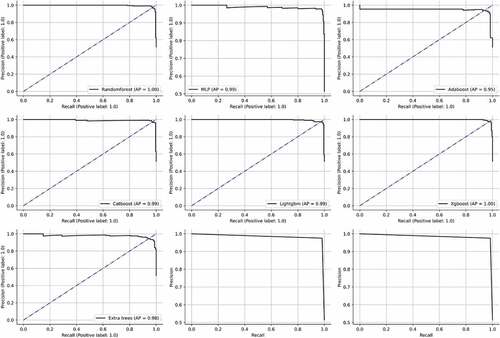
Figure 16. Confusion matrices: (a) STACK A (b) STACK B (c) STACK C.
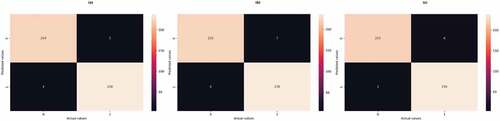
Table 6. Performance evaluation of bagging and boosting classifiers after data balancing and hyperparameter tuning
Figure 17. Feature importance using SHAP. (a) Bee swarm plot (b) Mean SHAP values.
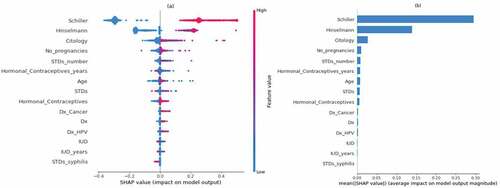
Figure 18. Feature importance using random forest.
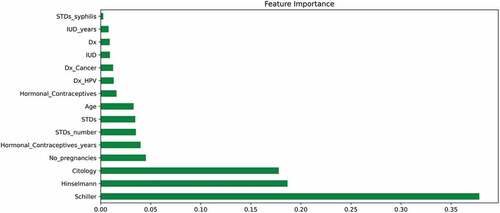
Figure 19. Feature importance using LIME (Positive Biopsy result).
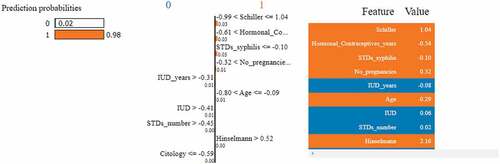
Figure 20. Feature importance using LIME (Negative Biopsy result).
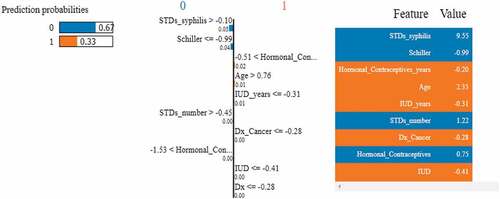
Figure 21. Feature importance using LIME graphs. (a) Positive biopsy result (b) negative biopsy result.
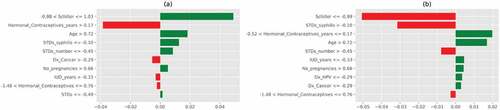
Figure 22. Feature importance using ELI5 for cervical cancer positive biopsy result.
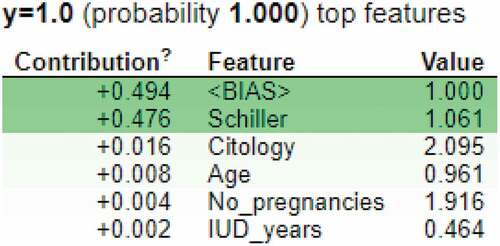
Figure 23. User interface of the prediction model deployed using “Gradio” to classify cervical cancer results.
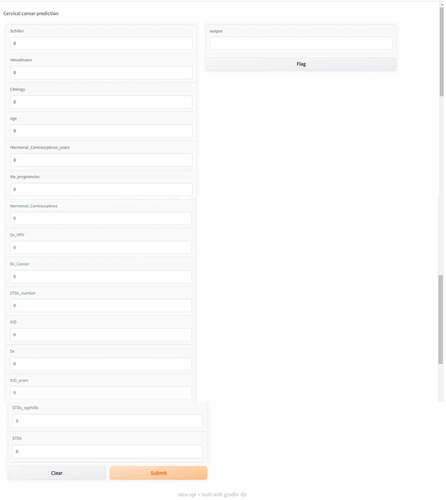
Table 7. Comparison of various researches