
Figures & data
Figure 1. Research flowchart.
Figure 2. The average of PVT value.
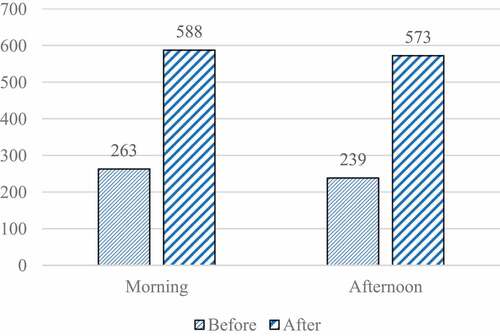
Table 1. The normality test of PVT
Table 2. PVT independent sample T-test results on morning and afternoon shifts
Figure 3. The average of VAS value.
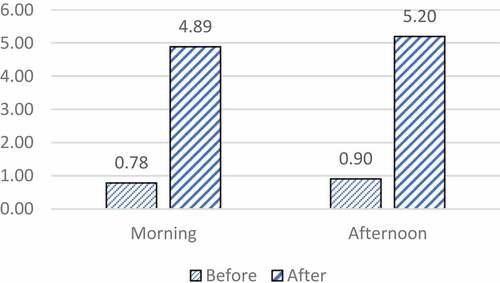
Figure 4. Average of KSS value.
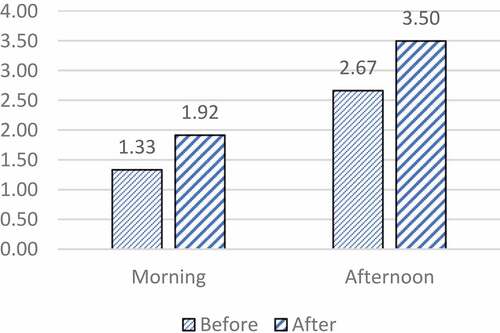
Table 3. VAS normality test
Table 4. Results of Mann Whitney U test VAS driver for morning shift and afternoon shift
Table 5. KKS normality test
Table 6. Results of Mann Whitney U on the KSS test for morning shift and afternoon shift drivers
Table 7. Correlations result
Table 8. Coefficient of determination
Table 9. Hosmer and lemeshow test
Table 10. Classification matrix
Table 11. Regression test results