Figures & data
Figure 1. Production profiles of the gas reservoirs studied. Modified after .Miller (Citation2009) and Dake (Citation2010)
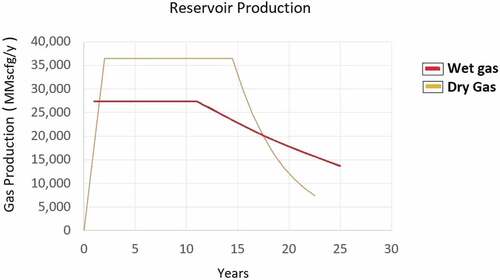
Figure 2. Production versus cumulative production plot.
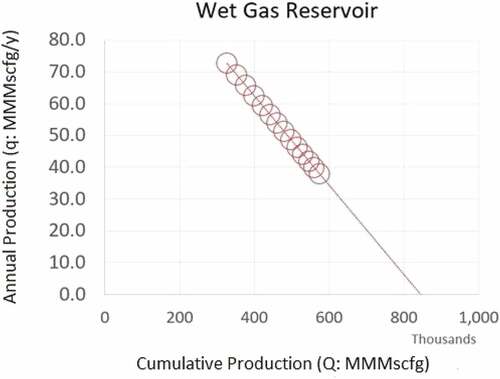
Figure 3. Wet gas reservoir production. Evolution in time of the P/R.
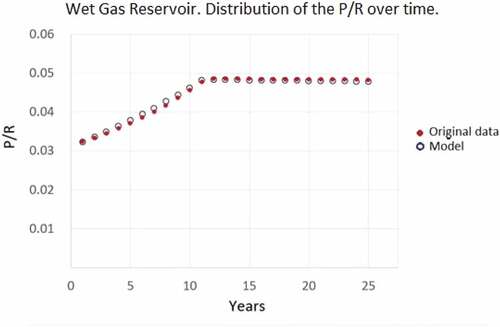
Figure 4. Production profile of a wet gas well in the North Field, Qatar. Modified after Miller. (Citation2009)
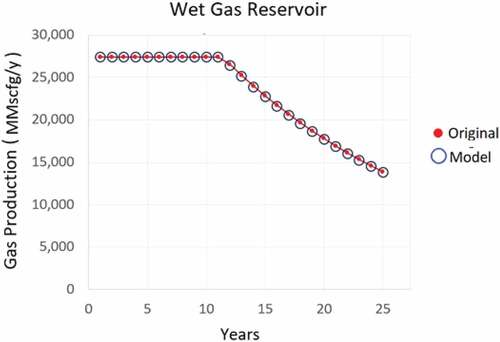
Figure 5. Production profile of a dry gas reservoir. Modified after. Dake (Citation2010)
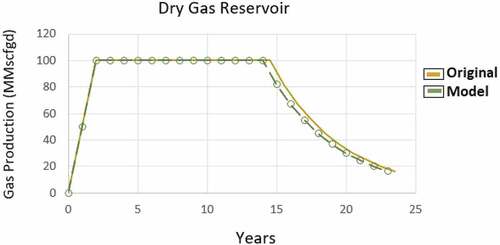
Figure 6. Dry gas reservoir production. Evolution in time of the P/R.
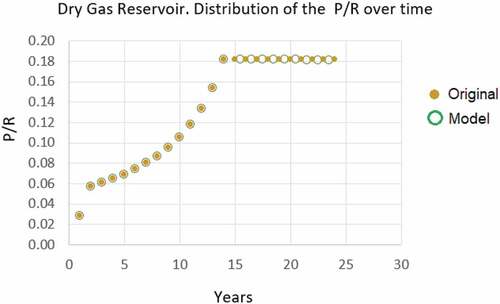
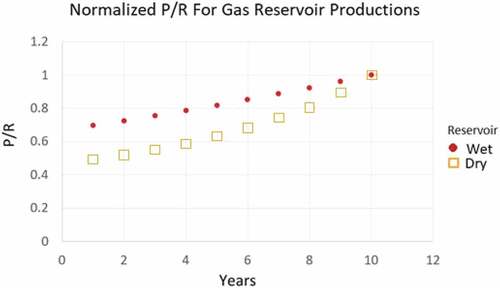
Figure 7. Dry and wet gas reservoir productions. Evolution in time of their respective normalized P/R.