
Figures & data
Table 1. Expert system developed by various authors for NTM selection
Table 2. Decision matrix: performance of various NTM processes to different attributes (N. D. Chakladar & Chakraborty, Citation2008)
Table 3. Normalised decision matrix
Table 4. Pairwise comparison matrix
Table 5. Weighted normalised matrix
Table 6. Concordance set
Figure 1. Console of the soft solution with instructions given for the input and output expected after the implementation of the mFS ELECTRE-I integrated approach.
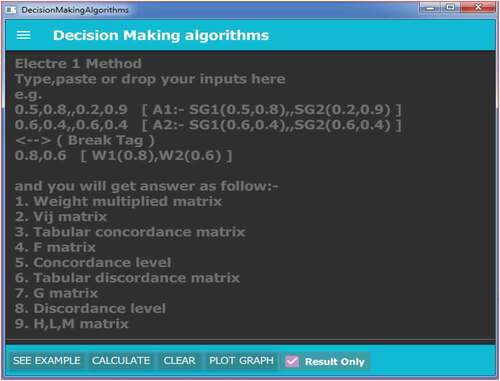
Figure 2. Actual input is given to the console in the form of normalised decision matrix and weight obtained from the AHP method.
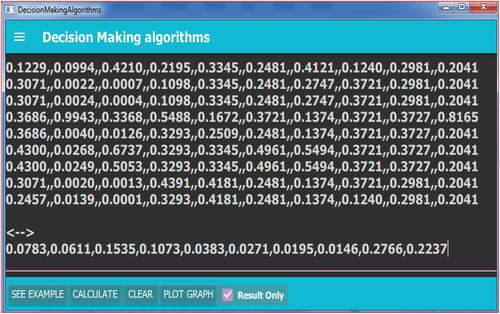
Figure 3. Results obtained for the given input data.
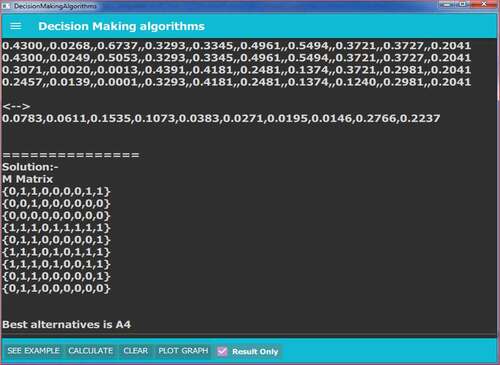
Figure 4. Directed graph is plotted on the console with C++ code for example-I.
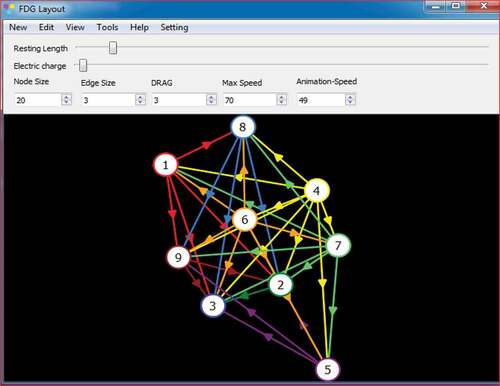
Table 7. Discordance set
Figure 5. Colour-directed graph, for example-I.
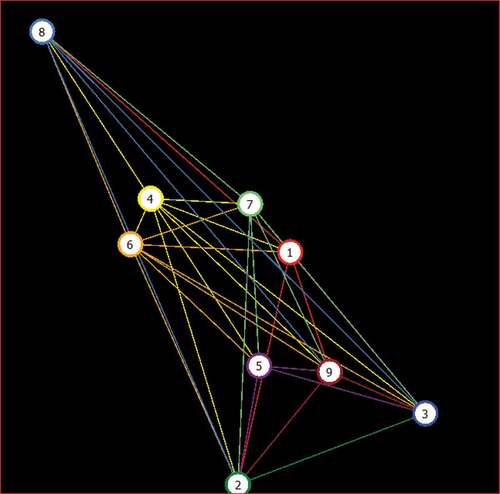
Table 8. Outranking relations between NTM processes
Table 9. Criteria weight variation for single-dimensional weight sensitivity analysis
Table 10. Alternatives with their ranks for criteria weight variation
Figure 6. Criteria weight variation for “Material” criteria v/s rank of alternatives.
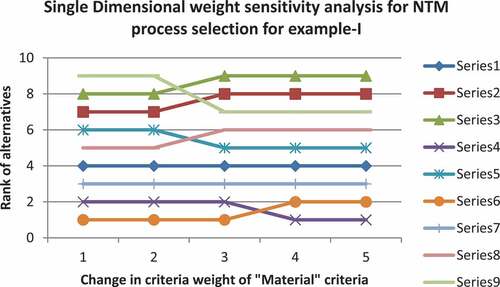
Table 11. Decision matrix: performance of various NTM processes to different attributes (N. D. Chakladar & Chakraborty, Citation2008)
Table 12. Normalised decision matrix
Table 13. Pairwise comparison matrix
Table 14. Weighted normalised matrix
Table 15. Concordance set
Table 16. Discordance set
Figure 7. Actual input is given to the console in the form of a normalised decision matrix and weight obtained from the AHP method for example-II.
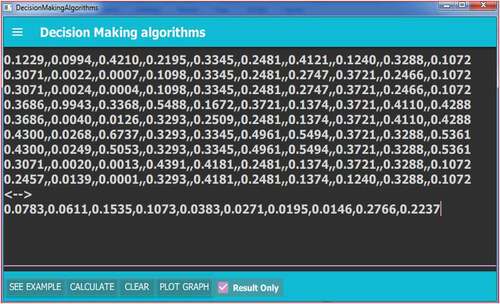
Figure 8. Results obtained for the given input data.
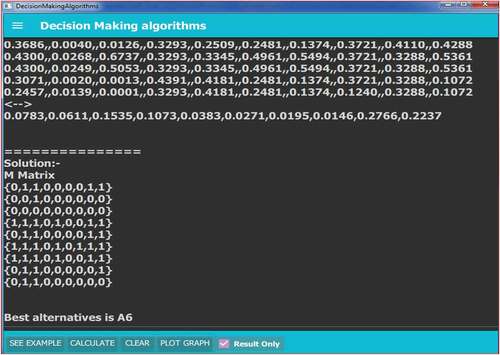
Figure 9. Directed graph is plotted on the console with C++ code for example-II.
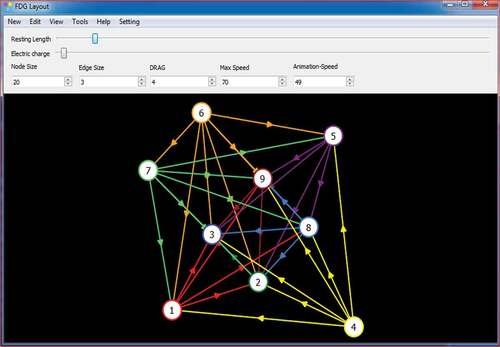
Figure 10. Colour-directed graph, for example-II.
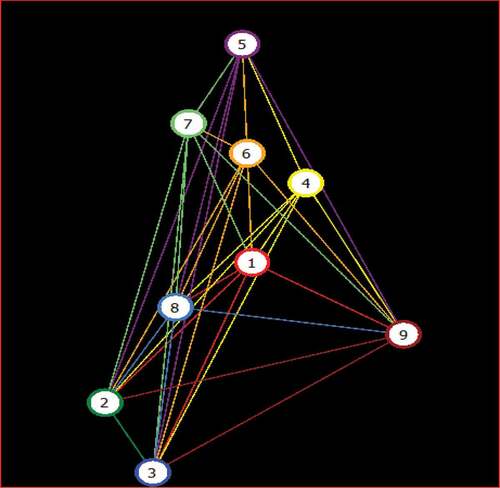
Table 17. Outranking relations between NTM processes
Table 18. Criteria weight variation for single-dimensional weight sensitivity analysis
Table 19. Alternatives with their ranks for criteria weight variation
Figure 11. Criteria weight variation for “Material” criteria v/s rank of alternatives.
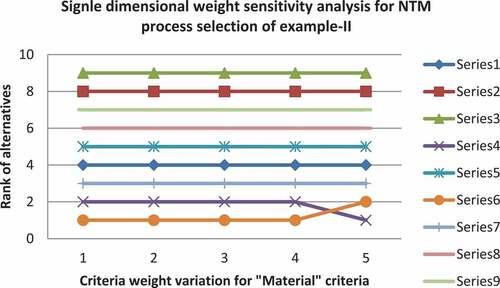
Table 20. Validation of results by comparing with the results of N. D. Chakladar & Chakraborty (Citation2008)