Figures & data
Figure 1. Shows the schematic classrooms used for the experiments with two exits, north and south door.
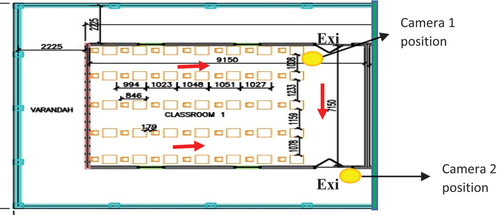
Figure 2. (a) shows a Snapshot of a single-door exit sitting arrangement, (b) single-door exit evacuations, (c) a Snapshot of two doors exit sitting arrangement (d) Two doors exit evacuations. Both doors have the same diameters of 1.6 m.
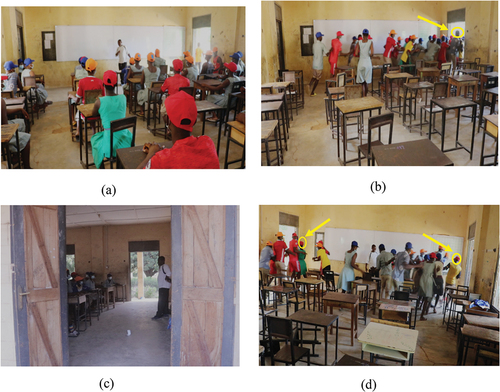
Figure 3. An improved version of the multi-grid model, (a) Implementation of a discretized model. According to the model, a pedestrian occupies a grid of 8 × 8 grids and can change better distances every time phase. (b) the diagram shows the informed procedure for every time phase; modernized is turned from minor to too big with the grid. At the exit, the grid is modernized first (Zhang et al., Citation2008). .
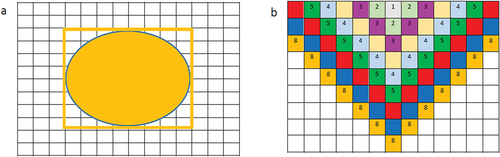
Figure 4. Using our developed multi-grid model, here are some simulation snapshots. (a) t = 7.68s (b) t = 8.56s.
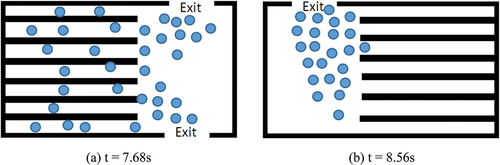
Figure 5. Velocity and time relationship of the individual moving trajectories base on one exit scenarios.
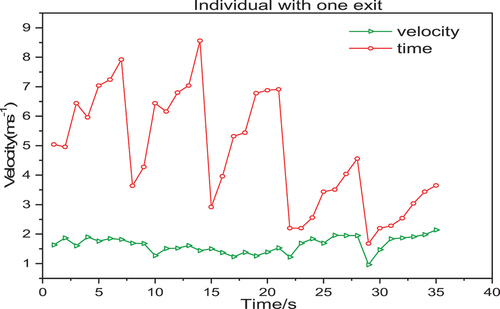
Figure 6. Velocity and time relationship of the individual trajectories base on two exit scenarios.
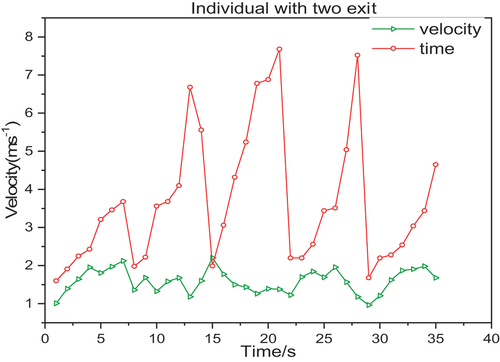
Table 1. (a) Illustrates individual times and velocities to the classroom exit. Colm (column)
Table 2. (a) Illustrate social groups’ velocity and times relationship with the two exits from the classroom
Figure 7. Velocity and time relationship of pedestrian’s trajectories in groups base one exit scenario.
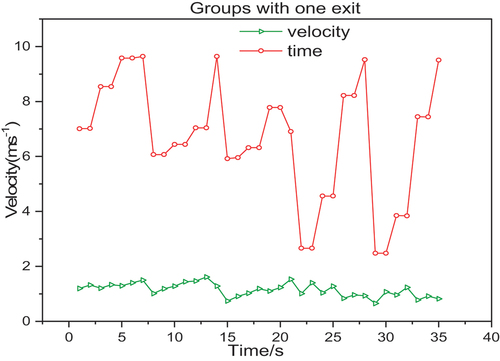
Figure 8. Velocity and time relationship of pedestrian’s trajectories in groups base two exit scenario.
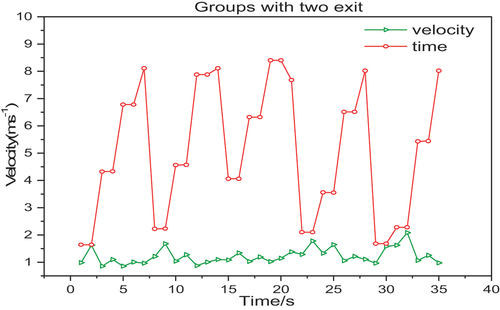
Figure 9. (a) (i) Shows the individual times for one exit with widths of 1.6m open for the students, and (ii) shows individual velocity for one exit with widths of 1.6m each open for the students. Figure .
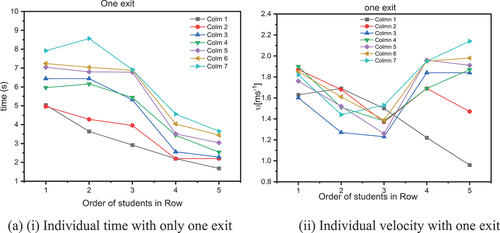
Figure 10. Shows the image time phases of a simulation showing people on the floor and existing scenario of one door.
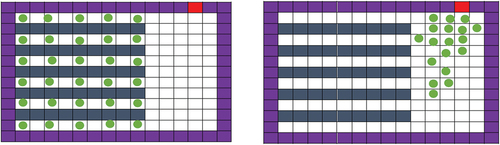
Figure 11. (b) (i) Shows the individual times for two exit with widths of 1.6m open for the students, and (ii) shows individual velocity for two exit with widths of 1.6m each open for the students.
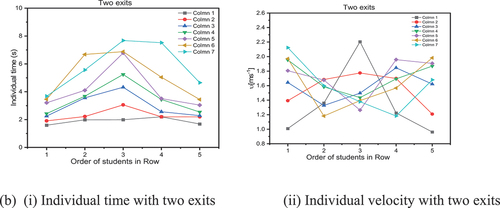
Figure 12. (a) (i) Shows the individual times for one exit with widths of 1.6m open for the students, and (ii) shows individual velocity for one exit with widths of 1.6m each open for the students.
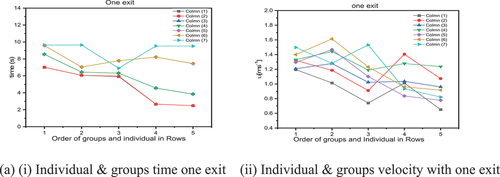
Figure 13. (b) (i) illustrates groups and individual times for two exits with widths of 1.6m open for the students, with (ii) shows groups and individual velocity for two exits, (b) (i) shows two exits for time and (ii) for velocity for groups and individual.
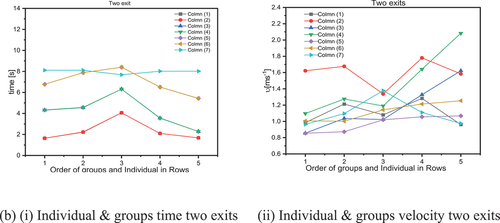
Figure 14. The classroom with two double-door exits, with the best locations for the doors.
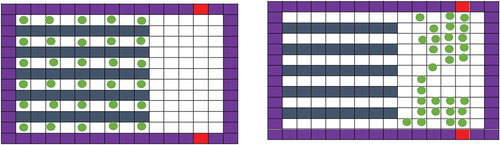
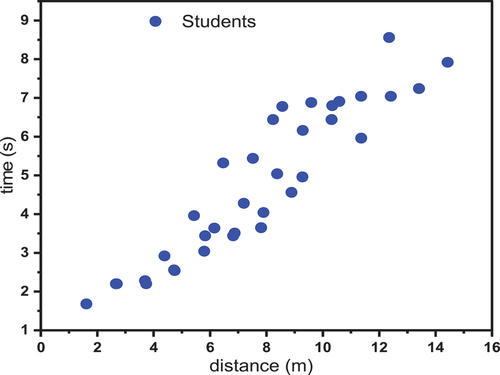
Figure 15. Illustrates the distance and time graph for groups and individuals in a graph.