Figures & data
Figure 1. Road map of Akoko Southwest local government of Ondo State. Inset: location map of Nigeria and Ondo state.
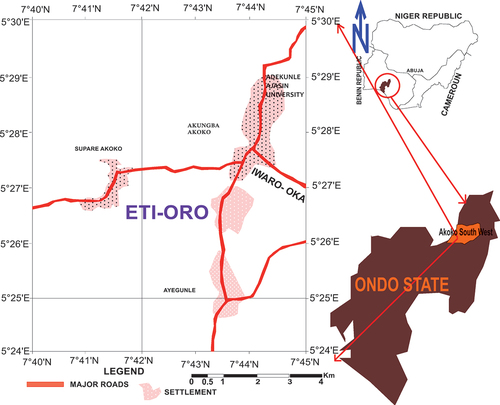
Figure 2. Geological map of Etioro-Akoko along with the nearby settlements in Ondo State, Southwestern Nigeria (modified after Akingboye & Osazuwa, Citation2021; Ogunyele et al., Citation2019).
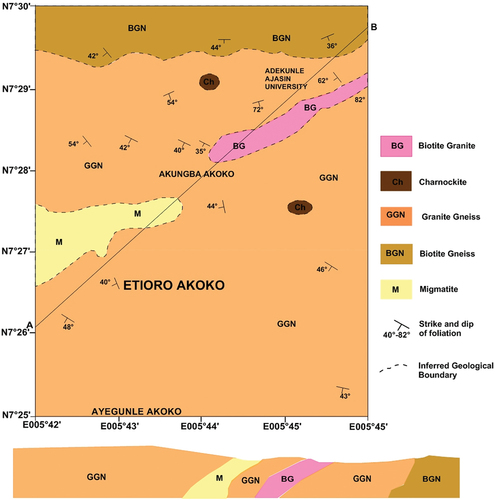
Figure 3. Data acquisitions map of the study area showing the locations of the ten trial pits vis a vis the six geophysical traverses (modified after Akingboye & Osazuwa, Citation2021).
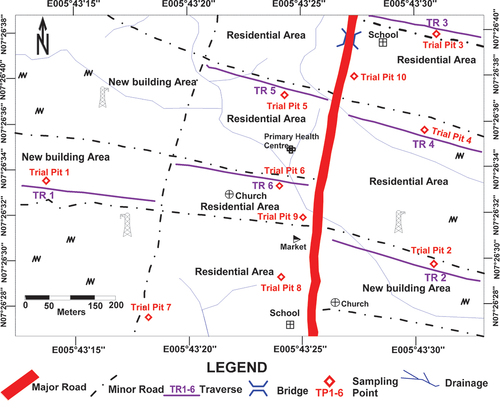
Figure 4. Grain size analysis of the ten trial pits soil samples from Etioro Akoko.
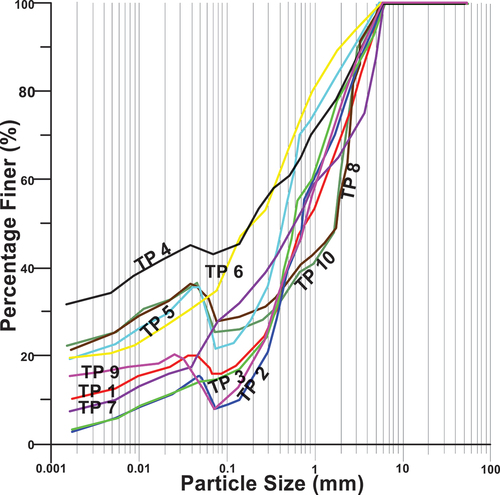
Figure 5. Casagrande plasticity chart plot of the ten trial pits soil samples (ASTMD 2487).
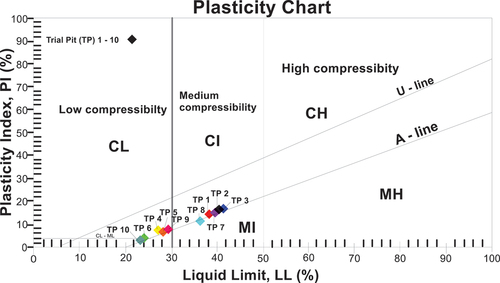
Figure 6. Plots of the ten trial pits sampled soils from Etioro Akoko on the activity chart.
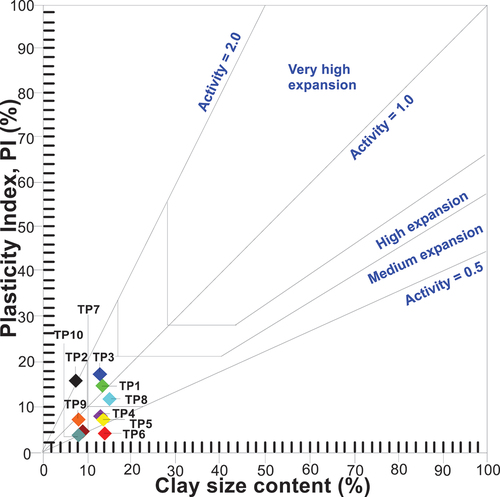
Figure 7. Plots of the activity character of the ten trial pits soil samples.
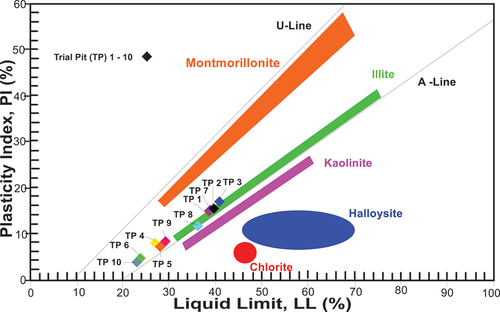
Figure 8. A model of geotechnical properties of soil samples in Etioro Akoko.
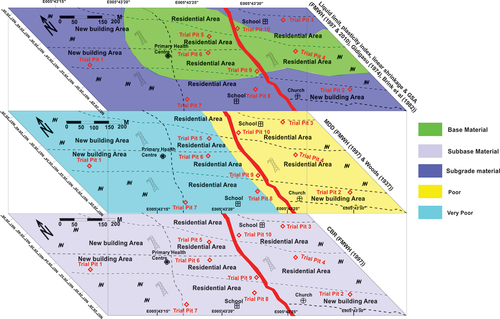
Table 1. Geotechnical properties of the soil taking from trial pits
Figure 9. Pseudo-section composite plot of the 2D resistivity inversion beneath (a) observed resistivity data, (b) computed resistivity distribution and (c) inverted resistivity structure.
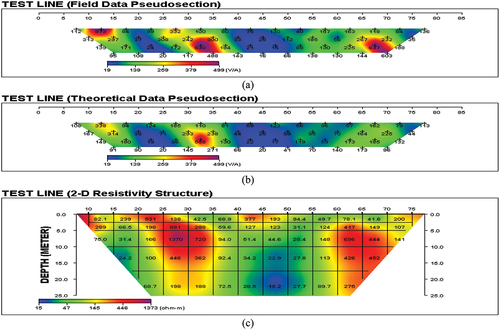
Figure 10. Pseudo-section composite plot of the 2D resistivity inversion beneath (a) observed resistivity data, (b) computed resistivity distribution and (c) inverted resistivity structure.
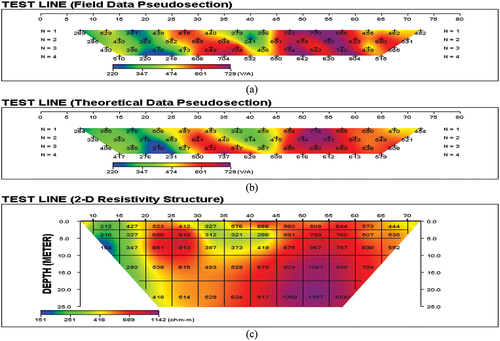
Figure 11. Pseudo-section composite plot of the 2D resistivity inversion beneath (a) observed resistivity data, (b) computed resistivity distribution and (c) inverted resistivity structure.
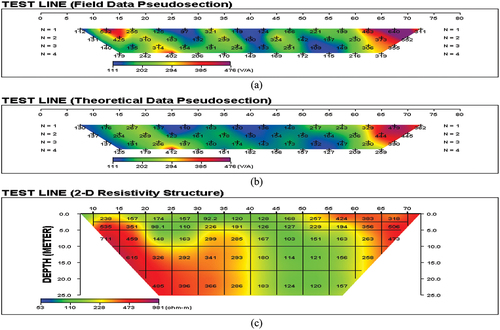
Figure 12. Pseudo-section composite plot of the 2D resistivity inversion beneath (a) observed resistivity data, (b) computed resistivity distribution and (c) inverted resistivity structure.
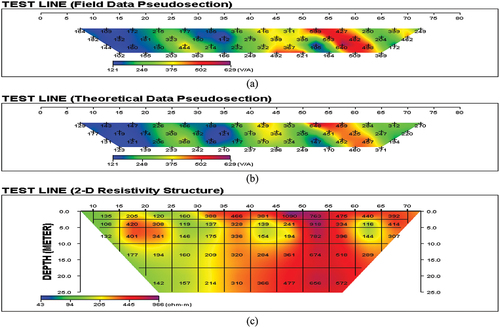
Figure 13. Composite plot of pseudo- section of result of 2D resistivity inversion beneath (a) observed resistivity data, (b) computed resistivity distribution and (c) inverted resistivity structure.
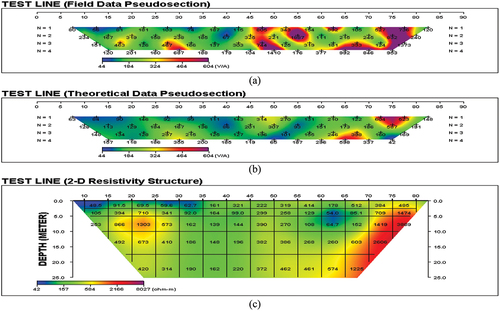
Figure 14. Pseudo-section composite plot of the 2D resistivity inversion beneath (a) observed resistivity data, (b) computed resistivity distribution and (c) inverted resistivity structure.
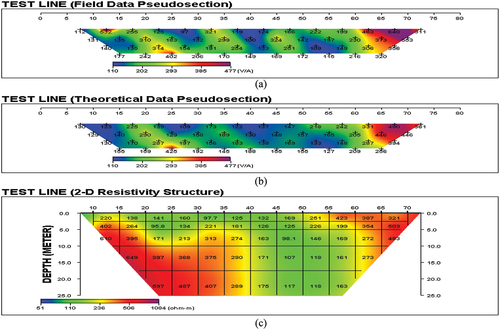
Figure 15. The litho-structural dynamics, competent layer for construction and proposed hand-dug well through fractured basement in Etioro Akoko.
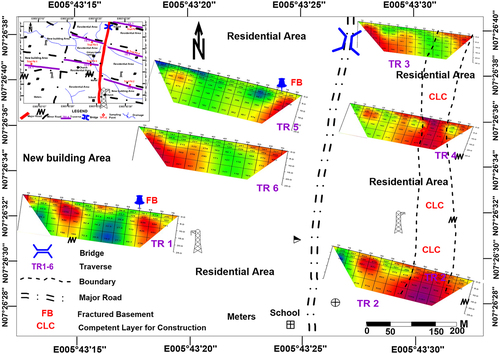
Figure 16. Regression plots and correlation coefficient (r) values between (a) mean resistivity values and % of fine (b) mean resistivity values and MDD values (c) mean resistivity values and percentage of clay (d) mean resistivity values and CBR values.
Figure 17. Regression plots and correlation coefficient (r) values between (a) fine contents and CBR values (b) % of fine and MDD values (c) % of clay and CBR values (d) % of clay and MDD values.