Figures & data
Figure 1. A typical architecture of CapsNet encoder with an image from MNIST dataset.
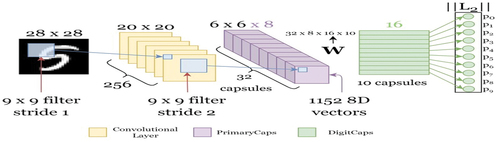
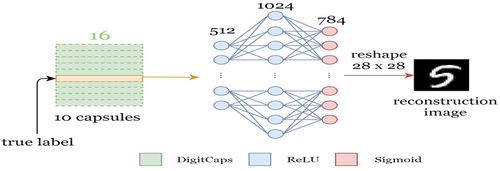
Figure 2. A typical architecture of CapsNet decoder with an image from MNIST dataset.
Table
Table 1. Some variants squash functions
Table 2. Properties of datasets
Table 3. Performance metrics on FMNIST
Figure 3. Comparison between different squash functions.
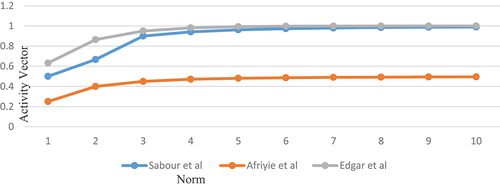
Figure 4. Plot of accuracy graphs for FMNIST: (a) Afriyie et al (Yaw et al., Citation2022b) model(b) Sabour et al (Sara et al., Citation2017) model(c) Edgar et al (Edgar et al., Citation2017) model.
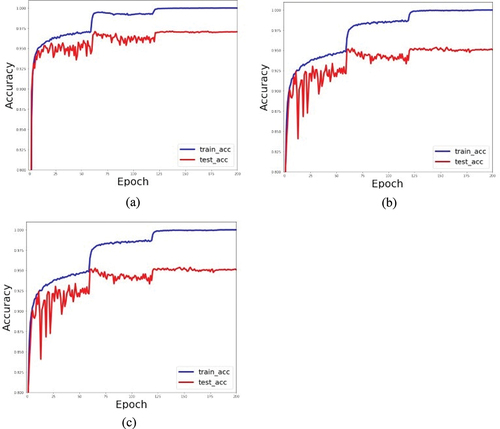
Figure 5. Plot of Loss graphs for FMNIST: (a) Afriyie et al (Yaw et al., Citation2022b) model(b) Sabour et al (Sara et al., Citation2017) model(c) Edgar et al (Edgar et al., Citation2017) model.
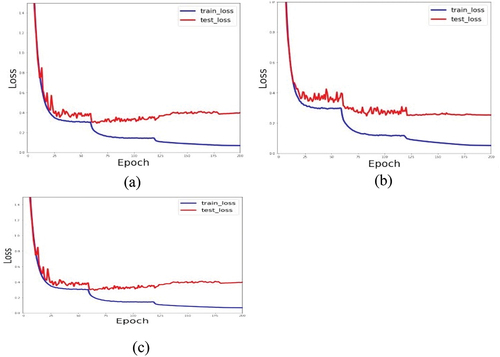
Figure 6. Plot of accuracy graphs for CIFAR10: (a) Afriyie et al (Yaw et al., Citation2022b) model(b) Sabour et al (Sara et al., Citation2017) model(c) Edgar et al (Edgar et al., Citation2017) model.
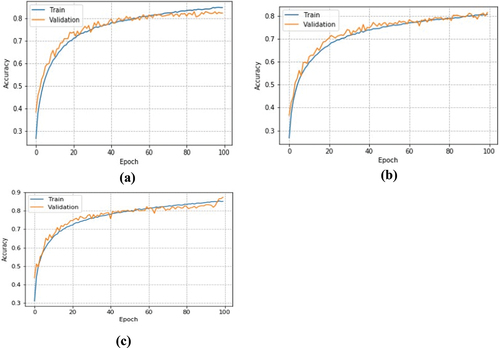
Table 4. Performance metrics on CIFAR-10
Figure 7. Multi-class Receiver Operating Characteristic (ROC) curves for FMNIST: (a) Afriyie et al (Yaw et al., Citation2022b) model(b) Sabour et al (Sara et al., Citation2017) model(c) Edgar et al (Edgar et al., Citation2017) model.
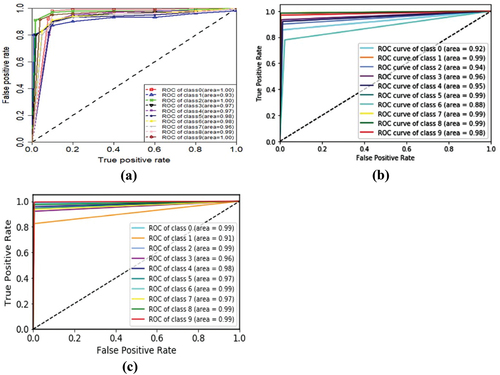
Figure 8. Precision-Recall curves for FMNIST: (a) Afriyie et al (Yaw et al., Citation2022b) model(b) Sabour et al (Sara et al., Citation2017) model(c) Edgar et al (Edgar et al., Citation2017) model.
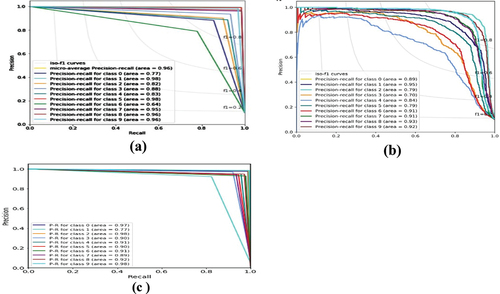
Figure 9. Multi-class Receiver Operating Characteristic (ROC) curves and Precision-Recall curves for CIFAR10. The (a), (b) and (c) represents the ROC curves for (a) Afriyie et al (Yaw et al., Citation2022b) model (b) Sabour et al (Sara et al., Citation2017) model. (c) Edgar et al (Edgar et al., Citation2017) model and the (d), (e) and (f) consists of the Precision-Recall curves of the respective models.
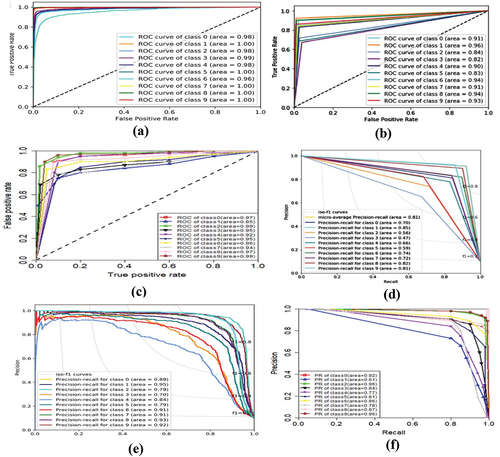
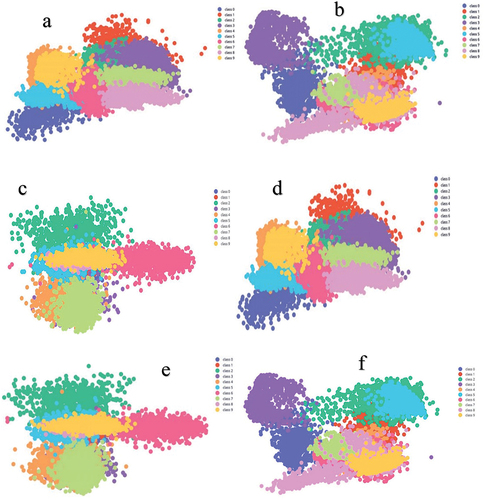
Figure 10. Visualization of the clusters formed at the: (a) FMNIST- caps-amp layer of the optimized model (b) FMNIST- caps-amp layer of the Sabour’s model (c) FMNIST- caps-amp layer of the Edgar’s model (d) CIFAR10- caps-amp layer of the optimized model (e) CIFAR10- caps-amp layer of the Sabour’s model (f) CIFAR10- caps-amp layer of the Edgar’s model.