Figures & data
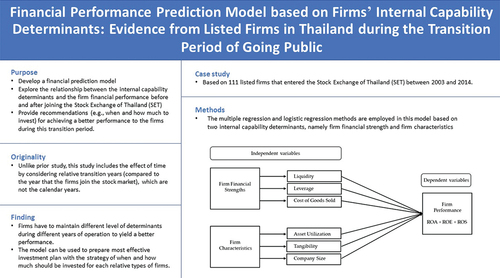
Table 1. A literature summary and research gap
Figure 1. Timeline Overview.
Table 2. Number of firms as classified by industry groups
Table 3. Number of new listed firms in each year
Table 4. Definition of dependent variable
Table 5. Definitions of independent variables
Figure 2. Conceptual framework.
Table 6. Pearson’s correlation coefficient of the case with one year before becoming public firms
Figure 3. Error assumptions of the multiple regression model for one year before becoming public firms.
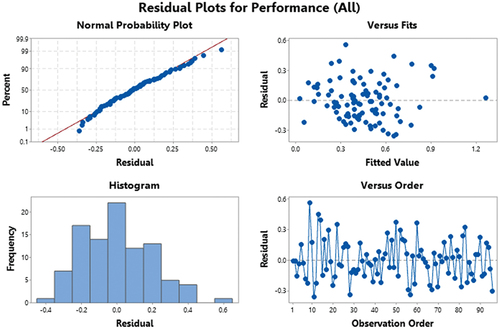
Table 7. MAPE of each multiple regression model
Table 8. Accuracy rates of logistic models
Figure 4. The impact of liquidity on predicted performance.
Figure 5. The impact of leverage on predicted performance.
Figure 6. The impact of COGS on predicted performance.
Figure 7. The impact of asset utilization on predicted performance.
Figure 8. The impact of tangibility on predicted performance.
Figure 9. The impact of company size on predicted performance.
Table 9. Status of the firm in each scenario
Table 10. Range variation of each factor
Table 11. Financial data of firm Z
Table 12. Status of firm Z
Table 13. Financial data of firm Z after the investment
Table 14. Status of firm Z after the investment
Table 15. Financial data of firm Z after the investment and the increase in sales
Table 16. Status of firm Z after the investment and the increase in sales
Figure 10. The financial performance prediction tool (input part).
Figure 11. The financial performance prediction tool (output part).