Figures & data
Table 1. Mechanical properties of superduplex stainless steel (UNS S32750)
Table 2. Chemical composition of superduplex stainless steel (UNS S32750)
Table 3. Values of welding input parameter
Figure 1. (a) Schematic of the welding setup (b) Photograph of gas tungsten arc welding of super-duplex stainless-steel pipe.
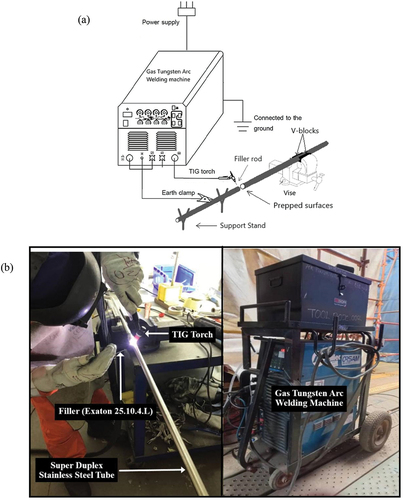
Table 4. Factorial points of welding input parameters
Table 5. Other parameters of the welding process
Figure 2. Photograph of setup for tensile testing.
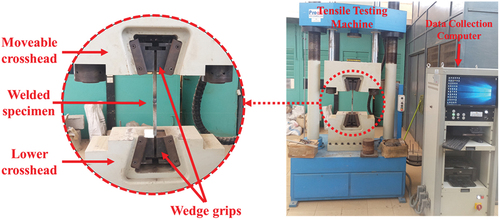
Table 6. Average response for the ultimate tensile strength and yield strength
Table 7. X-ray radiography tests
Table 8. Coded level with average UTS and YS response
Table 9. Coefficient of analysis for ultimate tensile strength and yield strength
Figure 3. Main effects plot for ultimate Tensile strength.
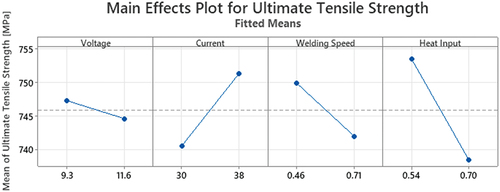
Figure 4. Main effects plot for yield strength.
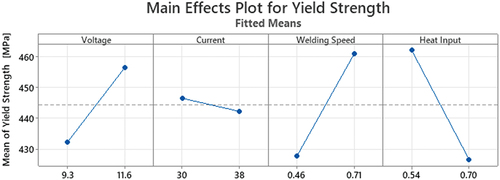
Figure 5. Interaction plot for ultimate tensile strength.
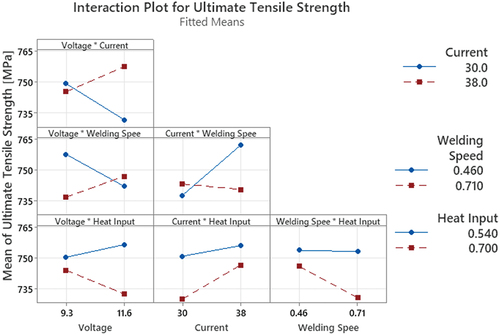
Figure 6. Interaction plot for yield strength.
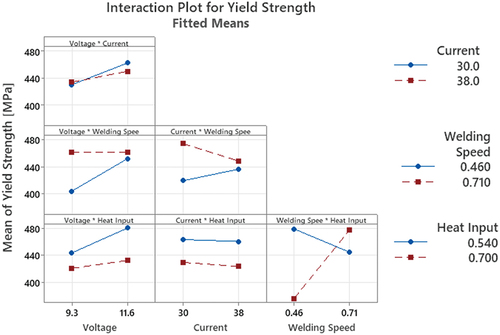
Figure 7. Pareto chart of standardized effects for UTS.
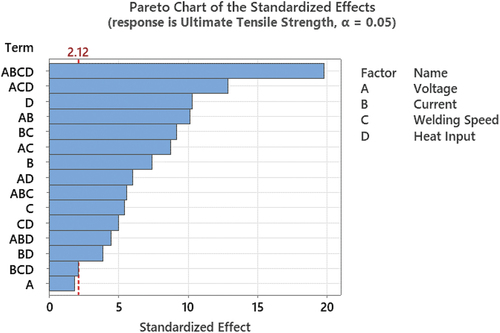
Figure 8. Pareto chart of standardized effects for YS.
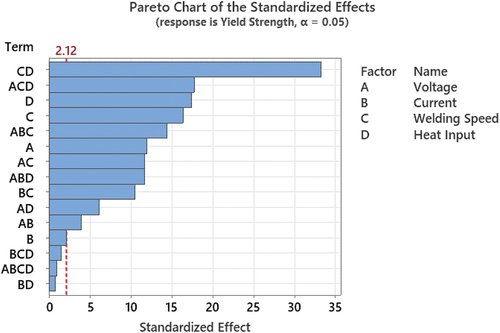
Table 10. Comparison of experimental values with predicted values of ultimate Tensile strength
Table 11. Comparison of experimental values with predicted values of Yield Strength
Figure 9. Optimization plot for ultimate tensile strength.
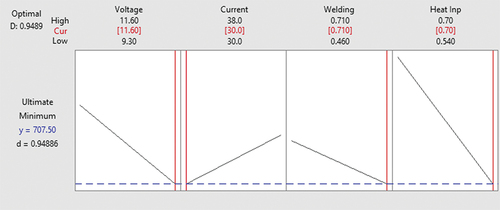
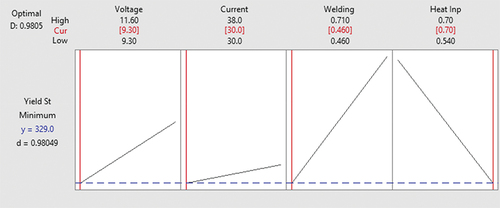
Figure 10. Optimization plot for yield strength.