Figures & data
Figure 1. The frequency distribution for classes of duplicated tweets.
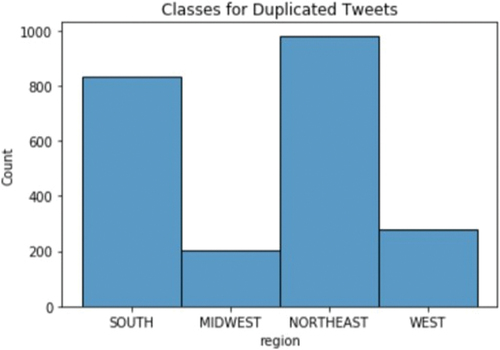
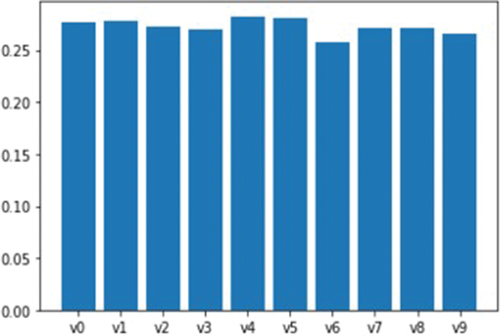
Figure 3. A comparison between training set performance and the development set performance.
Figure 2. Histogram of the Target Labels.
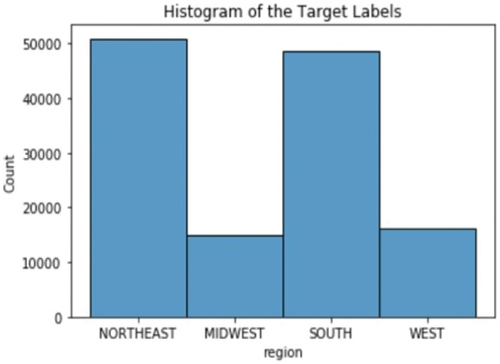
Figure 4. Training and development set confusion matrix.
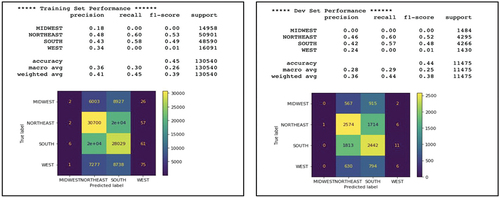
Figure 5. Development set performance.
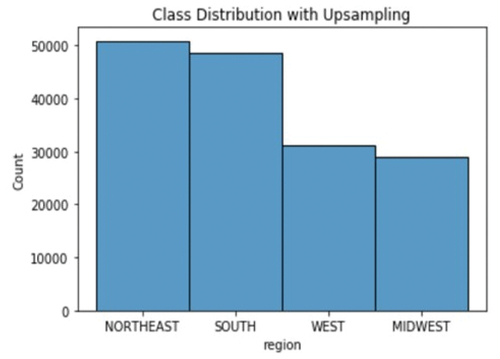
Figure 6. Training set performance after upsampling.
Figure 7. Training and development set confusion matrix.
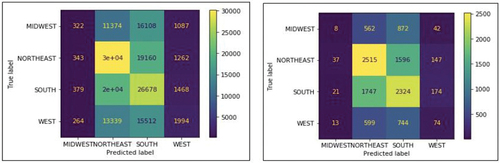
Figure 9. Class distribution after upsampling and down sampling.
Figure 8. Class distribution after upsampling and downsampling.
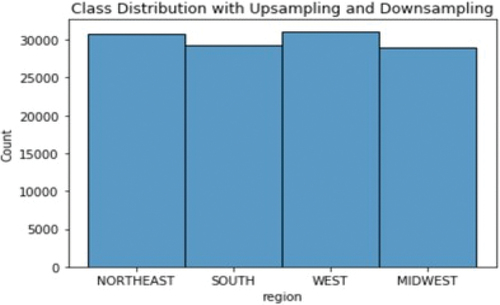
Figure 12. Development set performance after upsampling and downsampling.
Figure 13. Confusion matrix after another round of upsampling and downsampling.
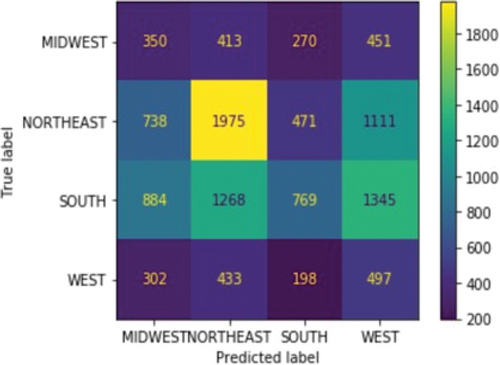
Figure 10. Confusion matrix after upsampling and down sampling.
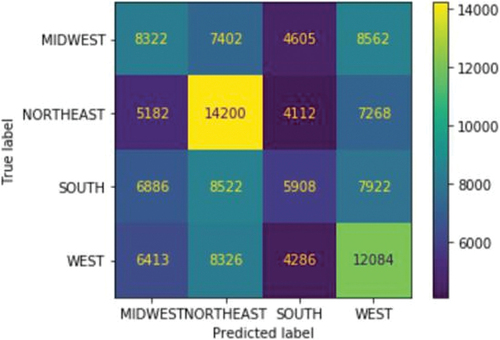
Figure 11. Training and development set performance after upsampling and down sampling.
Figure 14. Development set performance on different classifiers (precision, recall and f1-score).
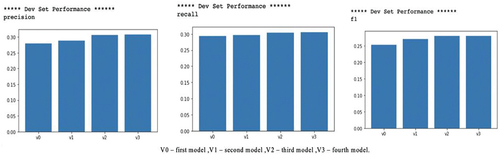
Figure 15. The development set performance for k equal to 3.
Figure 16. The Development set performance for k equal to 5.
Figure 17. Development set performance for k equal to 10.
Figure 18. Training and development set performance for rfc_1.
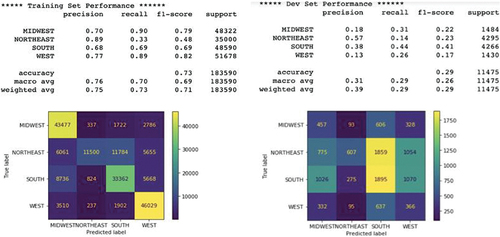
Figure 19. Training and Development set performance of rfc_2.
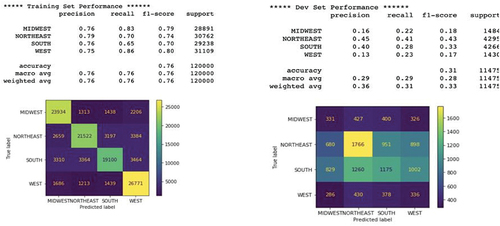
Figure 20. Training, development set performance and confusion matrix for rfc_3 (when after upsampling and downsampling) have been applied.
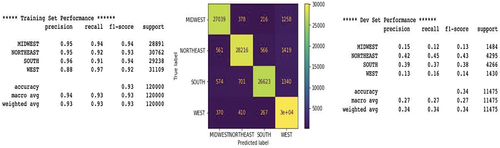
Figure 21. Training and development set performance for rfc_4.
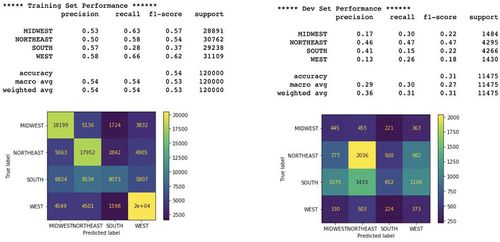
Figure 22. Training and development set performance evaluation for rfc_5.
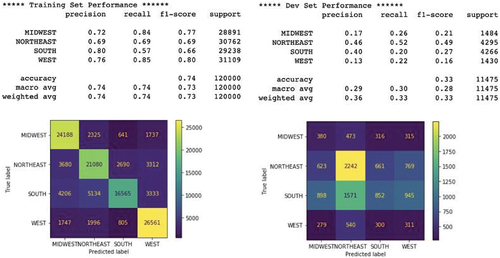
Figure 23. Class distribution with Upsampling.
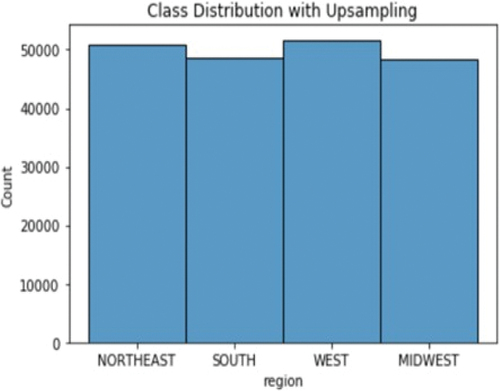
Figure 24. Confusion matrix after upsampling and downsampling.
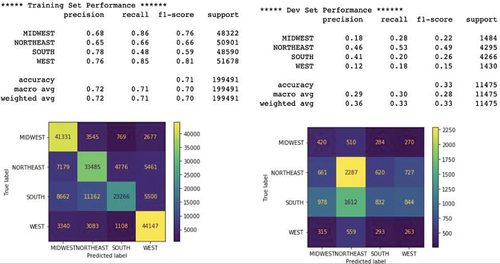
Figure 25. Training and development set performance for rfc_7 random forest classifier.
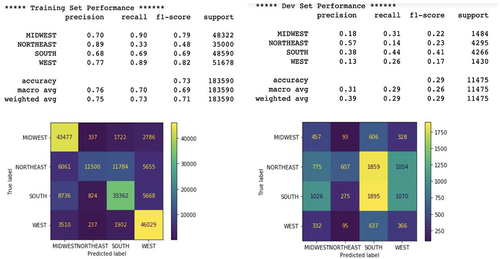
Figure 26. Training and development set performance for rfc_8.
Figure 27. Confusion matrix after two rounds of upsampling and downsampling.
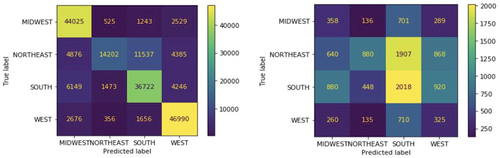
Figure 28. Confusion matrix for training and development set (after upsampling and downsampling).
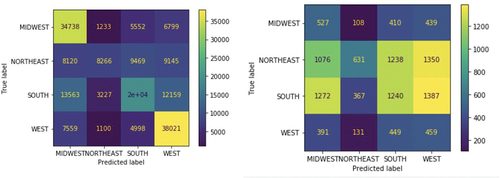
Figure 29. Training and Development set performance for rfc_9.
Figure 30. Training and development set performance after upsampling and downsampling.
Figure 31. Confusion matrix for the training set and development set, After upsampling and downsampling.
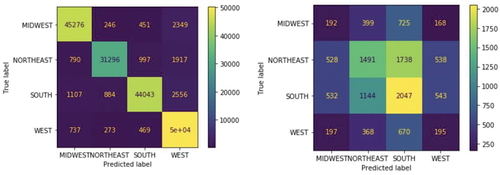
Figure 32. Training and development set performance for rfc_11.
Figure 33. Confusion matrix for training and development set (after upsampling and downsampling).
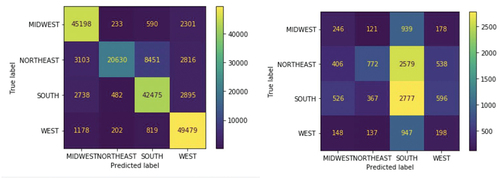
Table 1. Optimal training set performance
Table 2. Optimal development set performance
Figure 34. The concept of Precision and recall.
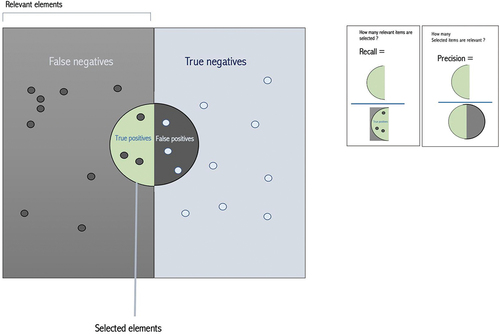
Figure 35. Final comparative results of performance among different classifiers.