Figures & data
Figure 1. (a) Intraply fabric and (b) Representation of intraply weaving design.
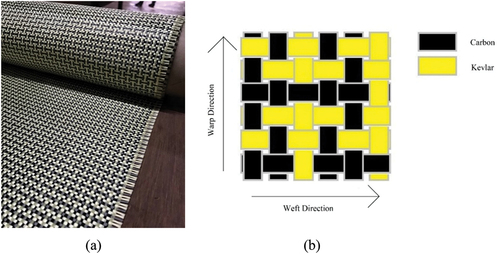
Table 1. Details of the fabric used
Table 2. Details of the matrix used
Figure 2. Fibre orientation and stacking arrangement of the fabricated laminate (1 and 8 represent the top and bottom layers).
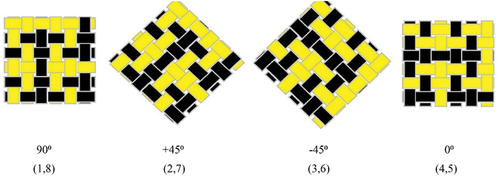
Figure 3. (a) Compression molding machine (b) Cured laminate.
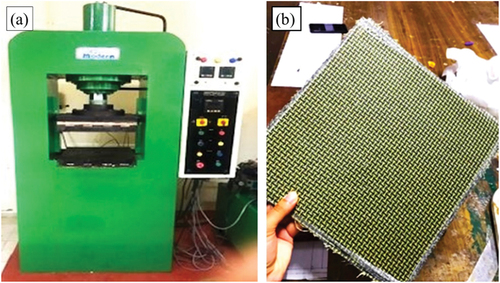
Figure 4. (a) Tensile test setup (b) Test specimen.
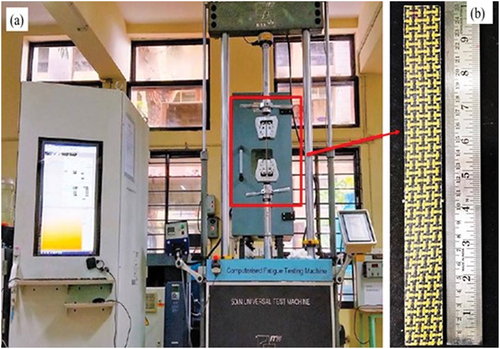
Figure 5. Flexural test setup.
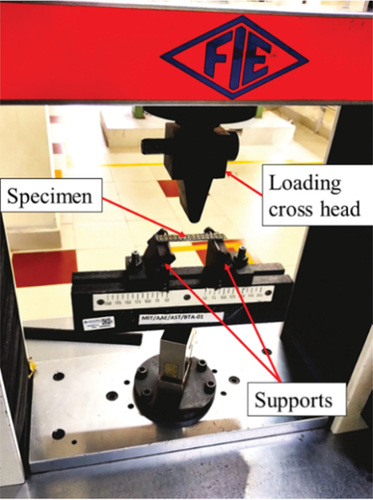
Figure 6. (a) Impact hammer test setup (b) Test specimen.
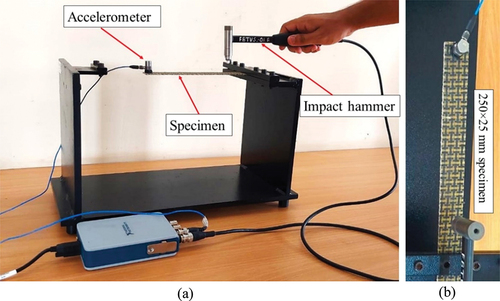
Table 3. Specimen coding and test details
Figure 7. Moisture absorption behaviour of the laminate for different ageing conditions.
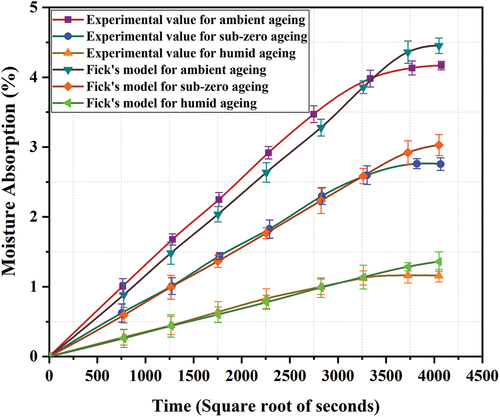
Table 4. Moisture diffusion parameters
Table 5. Tensile properties of the specimens
Figure 8. Stress vs strain graphs of pristine and aged specimens.
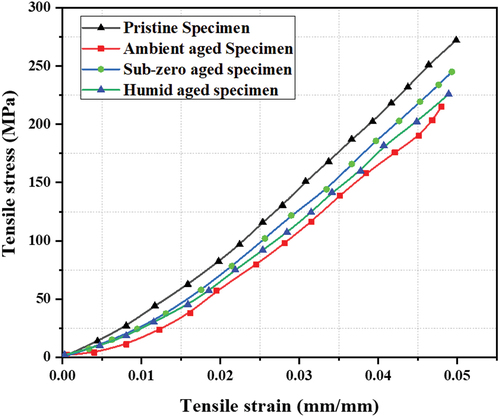
Figure 9. Ultimate tensile strength and modulus of the specimens.
Figure 10. Strength retention after tensile testing.
Figure 11. SEM micrographs of fractured (a) Pristine (b) Ambient (c) Sub-zero and (d) Humid aged tensile test specimens.
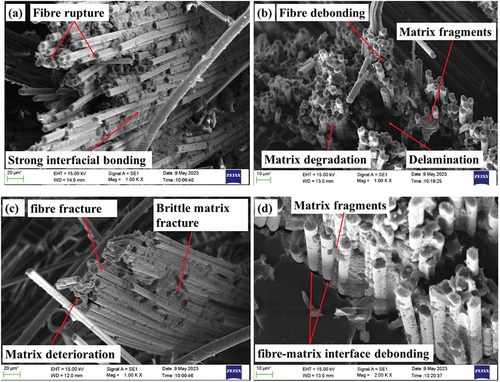
Figure 12. Flexural strength and modulus of pristine and aged specimens.
Figure 13. (a) Post flexural test samples (b) Enlarged view of the fractured area.
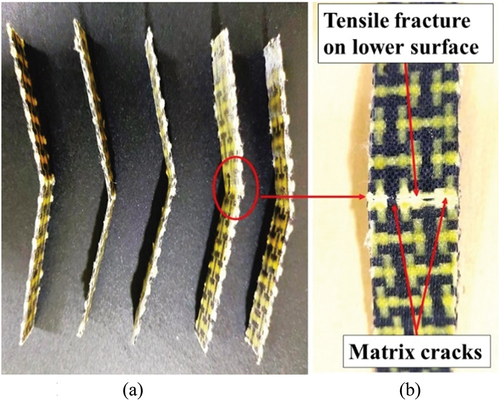
Figure 14. SBS strength and SBS strength retention of pristine and aged samples.
Figure 15. Light microscope pictures of fractured (a) Pristine (b) Ambient (c) sub-zero and (d) humid aged SBS test specimens.
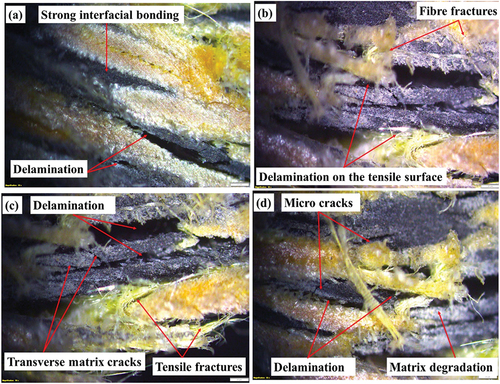
Table 6. Damping properties of pristine and aged specimens
Figure 16. Damping characteristics of pristine specimens (a) Acceleration amplitude vs frequency (b) Acceleration amplitude vs time.
Figure 17. Damping characteristics of ambient aged specimens (a) Acceleration amplitude vs frequency (b) Acceleration amplitude vs time.
Figure 18. Damping characteristics of sub-zero aged specimens (a) Acceleration amplitude vs frequency (b) Acceleration amplitude vs time.
Figure 19. Damping characteristics of humid aged specimens (a) Acceleration amplitude vs frequency (b) Acceleration amplitude vs time.