Figures & data
Figure 1. Diagram of the overall system.
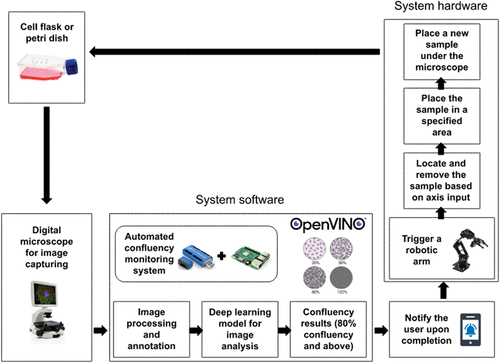
Figure 2. Sample fibroblast cells images from the dataset with 10x and 4x magnifications.
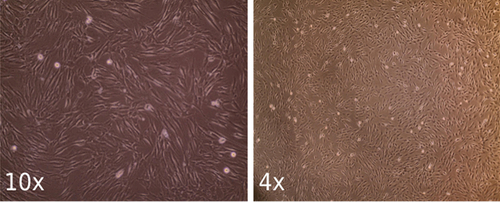
Figure 3. U-Net architecture used for model training.
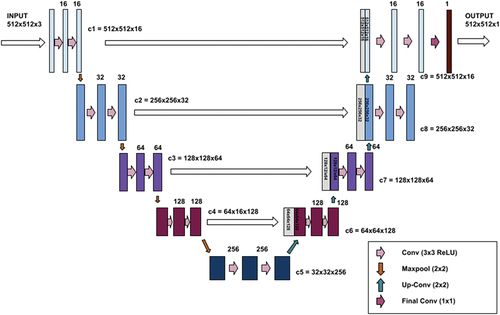
Figure 4. Illustration of the patching-unpatching technique. (a) Original image (b) Patched images (c) Patched images with predictions and (d) Unpatched (reconstructed) image.
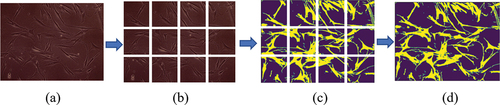
Figure 5. Illustration of the robotic arm initial parameters.
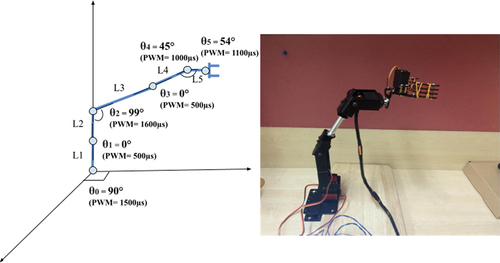
Figure 6. The prototype of the developed automated cell detection and characterisation using AIoT.
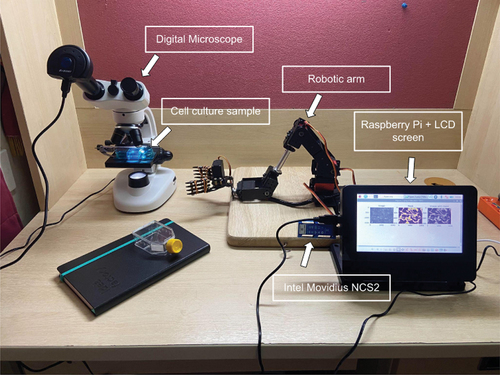
Figure 7. (a) Prediction on 4x magnification image and (b) prediction on 10x magnification image.
Table 1. Evaluation of the CNN model
Figure 8. Results of confluency estimation for (a) 4x magnification and (b) 10x magnification.
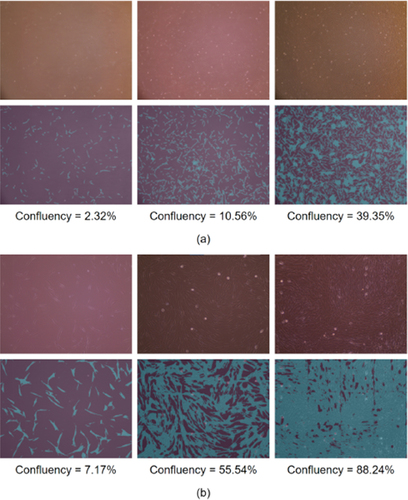
Table 2. Performance of the AIoT system on different platforms
Figure 9. Schematic diagram of the integrated AIoT system.
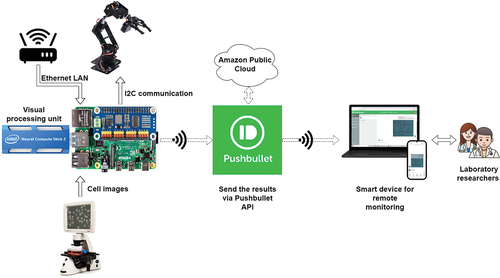
Figure 10. Model training performance graphs.
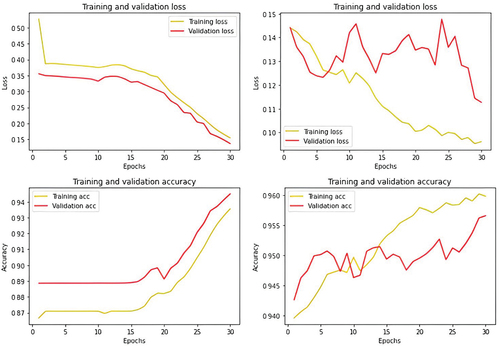
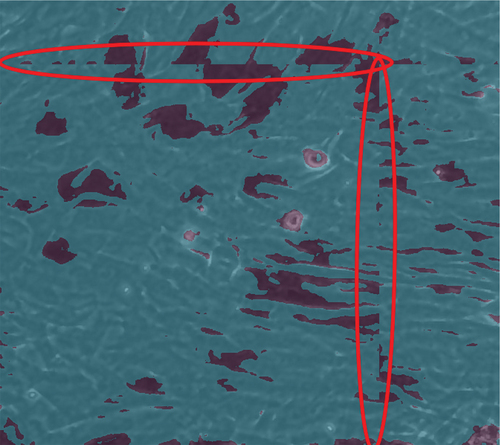
Figure 11. Errors caused by the patching-unpatching technique.