
Figures & data
Table 1. Chemical composition of AISI 5140 steel and copper
Figure 1. Annealing heat treatment procedure for (a) AISI 5140 steel (b) copper.
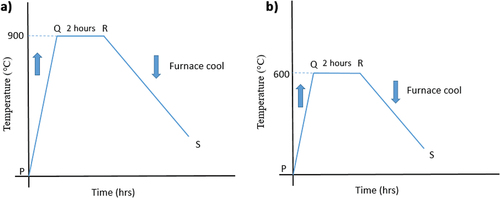
Figure 2. Annealing process and the metal specimen after annealing.
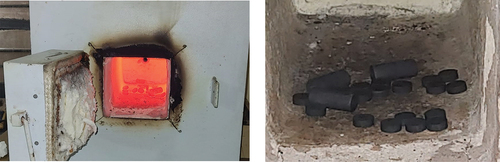
Figure 3. Optical microstructure of AISI 5140 steel (a) prior to and (b) post-annealing at 900 °C. SEM micrograph of AISI 5140 steel (c) and (d) before annealing at 900 °C, (e) and (f) after annealing at 900 °C.
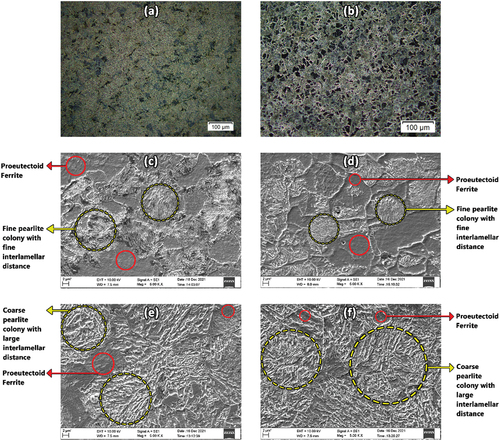
Figure 4. Optical microstructure of copper (a) prior to and (b) post-annealing at 600 °C. SEM images of copper c prior to and (d) post (c) before and annealing at 600 °C.
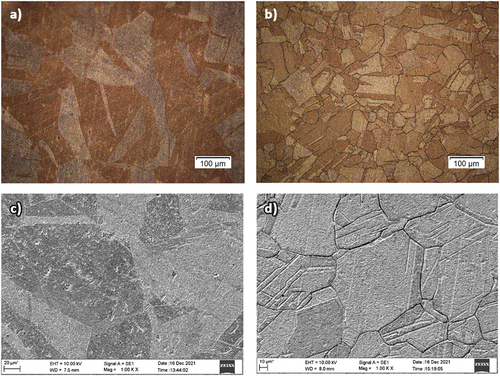
Figure 5. XRD profiles of (a) AISI 5140 steel and (b) Copper before and after heat treatment.
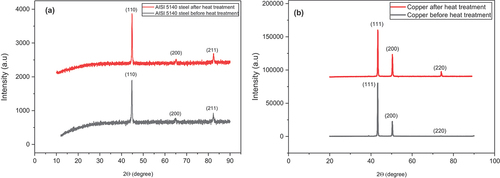
Table 2. The average crystallite size of AISI 5140 steel and copper before and after annealing
Table 3. Microhardness values of AISI 5140 steel and copper
Figure 6. Nyquist plots of AISI 5140 steel (a) prior and (b) post-annealing in 3.5 wt% NaCl solution at different temperatures. Bode plots for the corrosion of AISI 5140 steel (c) before and (d) after annealing in 3.5 wt% NaCl solution at different temperatures.
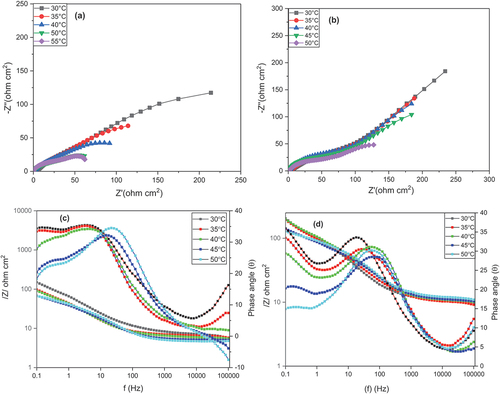
Figure 7. Nyquist plots for the corrosion of copper (a) before and (b) after annealing in 3.5 wt% NaCl solution at different temperatures. Bode plot for the corrosion of copper (c) before and (d) after annealing in 3.5 wt% NaCl solution at different temperatures.
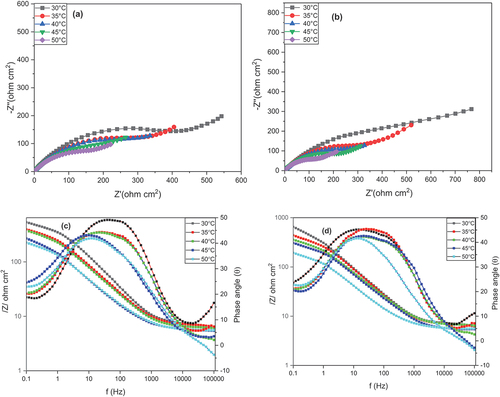
Figure 8. Equivalent circuit for Nyquist plots for the corrosion of (a) AISI 5140 steel and (b) copper in 3.5wt% NaCl medium.
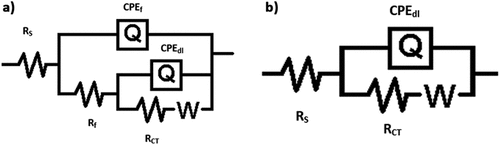
Table 4. Results of EIS measurements for the corrosion of AISI 5140 steel before and after heat treatment in 3.5 wt% NaCl solution
Table 5. Results of EIS measurements for the corrosion of copper before and after heat treatment in 3.5 wt% NaCl solution
Figure 9. Tafel plots for the corrosion of AISI 5140 steel (a) before and (b) after annealing in 3.5 wt% NaCl solution. Tafel plots for the corrosion of Copper (c) before and (d) after annealing in 3.5 wt% NaCl solution.
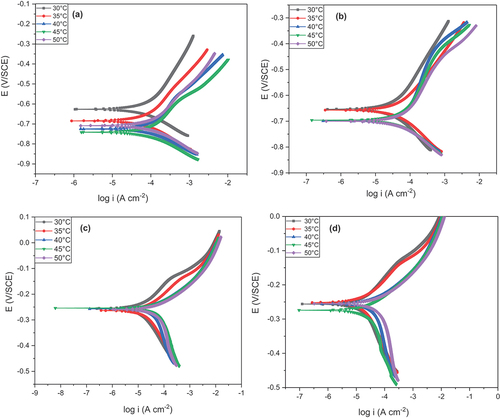
Table 6. Results of PDP measurements for the corrosion of AISI 5140 steel before and after heat treatment in 3.5 wt% NaCl solution
Table 7. Results of PDP measurements for the corrosion of copper before and after heat treatment in 3.5 wt% NaCl solution
Figure 10. Arrhenius plots of (a) AISI 5140 steel (b) copper in 3.5 wt% NaCl solution for the corrosion in as-bought and annealed condition.
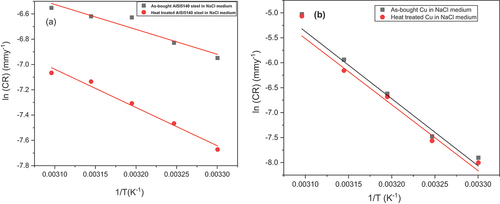
Table 8. Activation parameters for the corrosion of AISI 5140 steel and copper in 3.5 wt% NaCl in as-bought and annealed conditions
Figure 11. Plots of ln (CR/T) versus 1/T of (a) AISI 5140 steel (b) copper in 3.5 wt% NaCl solution for the corrosion in as-bought and annealed condition.
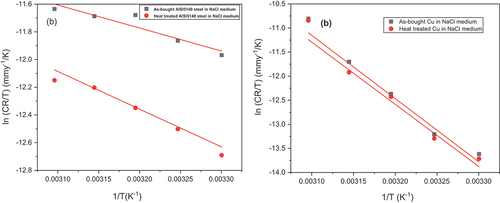
Figure 12. SEM micrographs of (a) AISI 5140 steel without any treatment (b) AISI 5140 steel after immersion in 3.5 wt% NaCl solution.
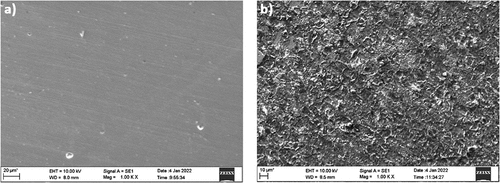
Figure 13. SEM images of (a) copper (without treatment) (b) AISI 5140 steel after immersion in 3.5 wt% NaCl solution.
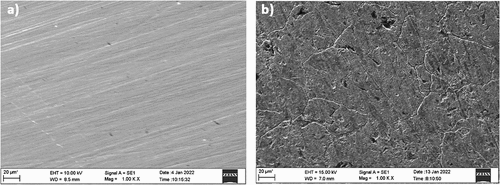
Figure 14. EDX images of (a) freshly polished AISI 5140 steel (b) AISI 5140 steel after immersion in 3.5 wt% NaCl solution.
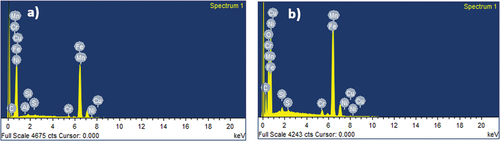
Figure 15. EDX images of (a) freshly polished copper (b) copper after immersion in 3.5 wt% NaCl solution.
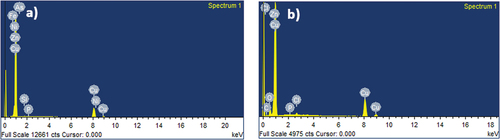
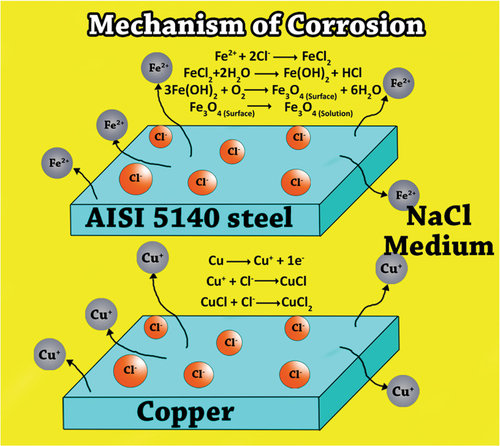
Figure 16. Mechanism of corrosion of AISI 5140 steel and copper.
Data availability statement
Inquiries about data availability should be directed to the corresponding author.