
Figures & data
Table 1. Influence of turbulators on the solar air heater performance
Table 2. Details of the inserts used in a tubular heat exchanger
Figure 1. Comparison between the CFD predicted and analytical values for Nu.
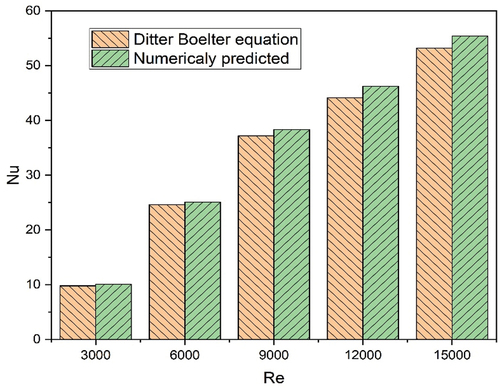
Figure 2. Schematic representation of the heat exchanger with the conical turbulator.
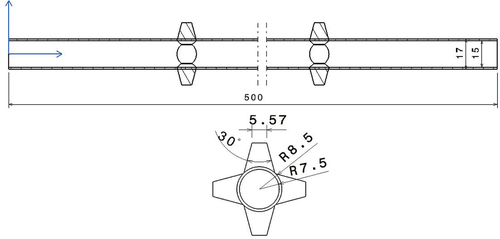
Figure 3a. Meshed model of the truncated conical turbulated heat exchanger.
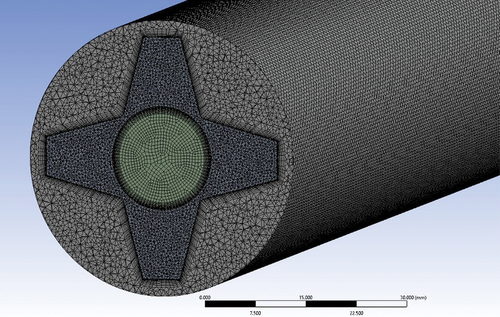
Figure 3b. Grid independence study for the truncated conical turbulated heat exchanger.
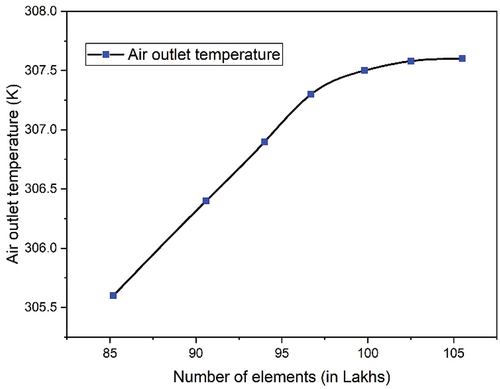
Table 3. Dimensions and Specifications of the heat exchanger
Figure 4. Contour plot showing the velocity variation (a) along the length (b) exit velocity for Re 3000 and 15,000.
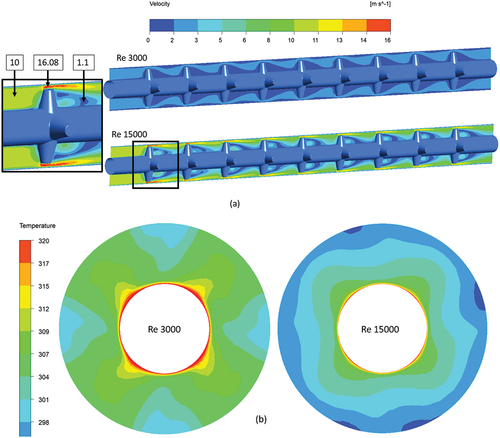
Figure 5. Contour plot showing the temperature variation along the length for Re 3000 and 15,000.
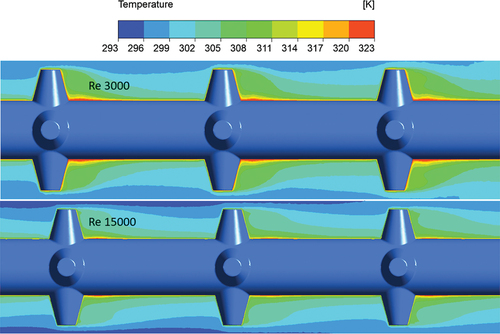
Figure 6. Contour plot showing the turbulent intensity variation along the length for Re 3000 and 15,000.
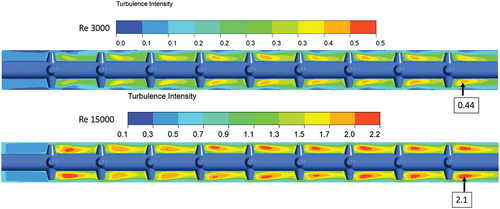
Figure 7. Contour plot showing the turbulent kinetic energy variation along the length for Re 3000 and 15,000.
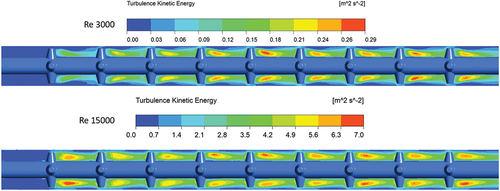
Figure 8. (A) variation of velocity contours (b) variation of turbulent intensity (c) exit temperature variation for different pitch values.
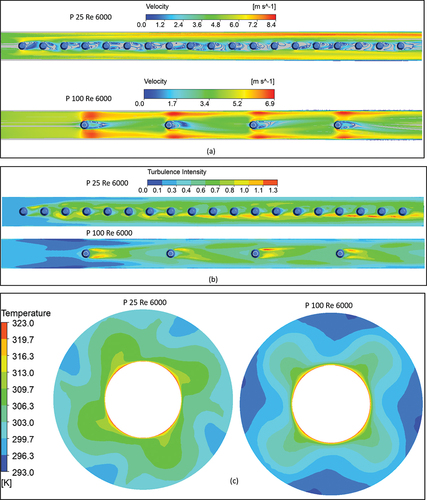
Figure 9. Variation of temperature along the length of the heat exchanger for different pitch values.
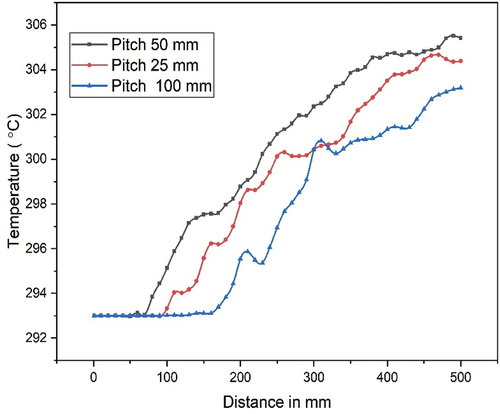
Figure 10. Variation of Nu and annulus HTC with pitch values for different Re.
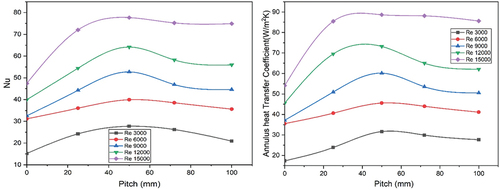
Figure 11. Variation of ΔP and friction factor with pitch values for different Re.
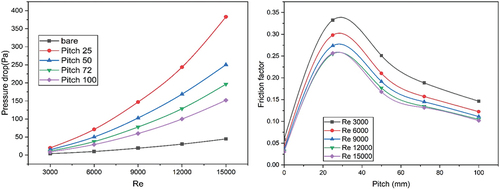
Figure 12. Variation of THPI with pitch values for different Re.
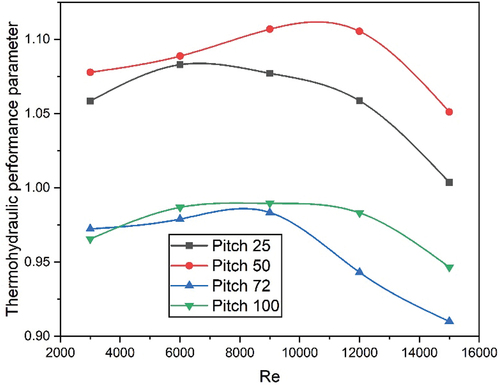
Table 4. Comparison of the present results with Published literature