
Figures & data
Table 1. Hazard categories based on implicit energy sources and typical examples
Table 2. Demographics of participants
Figure 1. Steam turbine and generator scene photograph before editing.
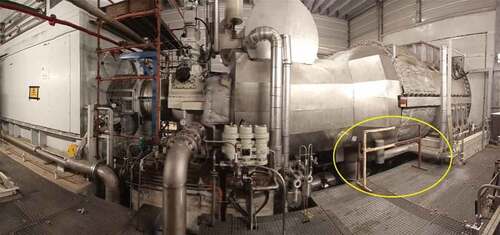
Figure 2. Sample edited photo used for hazard recognition measurement.
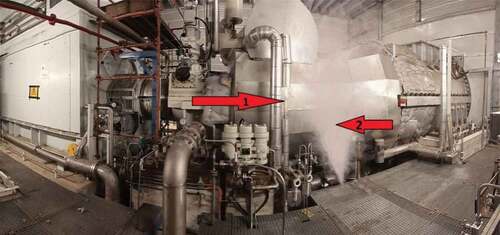
Table 3. Descriptive statistics of HR performance of participants by hazard category
Figure 3. Bar graph indicating workers overall hazard recognition performance.
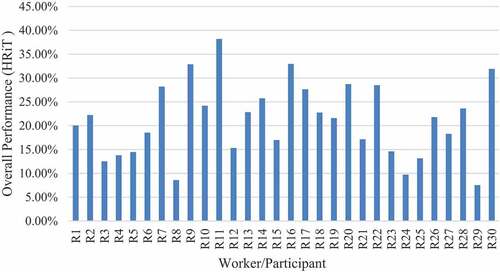
Table 4. Summary descriptive statistics of overall hazard recognition performance of all participants
Table 5. Kolmogorov–Smirnov and Shapiro–Wilk normality test results
Table 6. Levene’s homogeneity of variances test results
Table 7. Kruskal–Wallis test summary of hazard recognition performance by category
Table 8. Pairwise comparisons of hazard recognition performance levels across the eight hazard categories
Table 9. Summary of pairwise comparisons
Data availability statement
Data associated with this study will be made available upon request.