
Figures & data
Figure 1. Different graphical representations for pdf of the NKwE distribution.
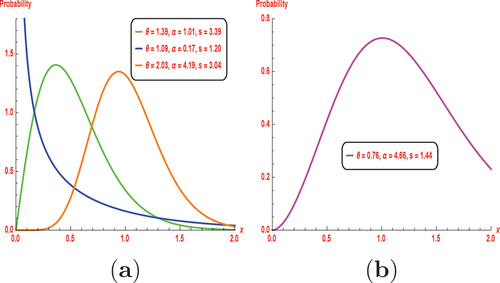
Figure 2. Different graphical representation for hrf of the NKwE distribution.
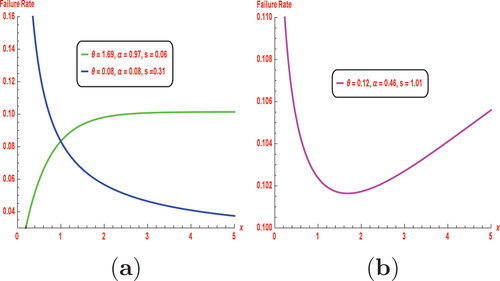
Table 1. GASP displaying minimal and
for
and
Table 2. GASP displaying minimal and
for
and
Table 3.
and
Figure 3. [1] and [2] are used as the sources of some parametric values for the graphical representation of g and OC.
![Figure 3. Tables 1 and 2 [1] and [2] are used as the sources of some parametric values for the graphical representation of g and OC.](/cms/asset/79c20bdd-d3f8-4e9e-9099-961e5dcde9c0/oaen_a_2257945_f0003_oc.jpg)
Table 4. The MLEs (SE), KS, and p-value for data set I
Figure 4. (a) Estimate the density, (b) estimate the cdf, (c) P-P, (d) Q-Q, (e) TTT, and (f) estimate the hrf.
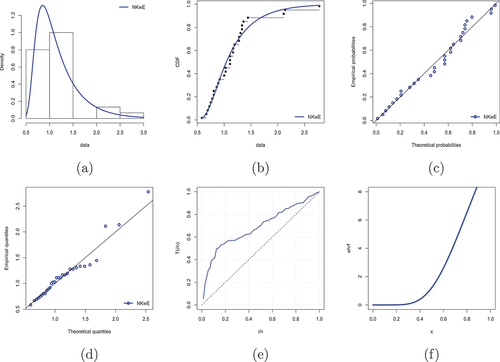
Table 5. GASP under NKwE model, = 0.2927 and
= 0.3132, displaying minimal
and
Table 6. The MLEs (SE), KS, and p-value for data set II
Figure 5. (a) Estimate the density, (b) estimate the cdf, (c) P-P, (d) Q-Q, (e) TTT, and (f) estimate the hrf.
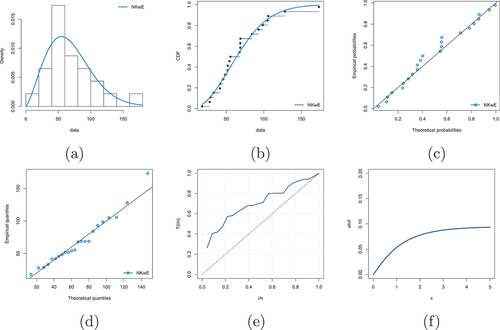
Table 7. GASP under NKwE model, = 2.5047 and
= 12.7570, displaying minimal
and
Figure 6. Plots of descriptive analysis for (a) data set I and (b) data set II.
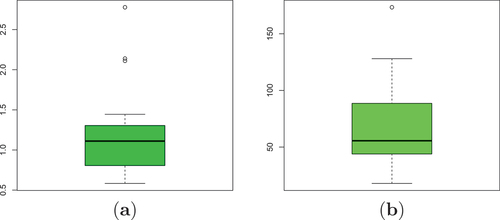
Table 8. Descriptive analysis of data sets
Table 9. True median lifetimes, sample sizes, ,
, and OC values of the two data sets
Table 10. Sample sizes of GASP and OSP
Data availability statement
The data presented in this study are available on request from the corresponding author.