Figures & data
Figure 1. Workpiece materials.
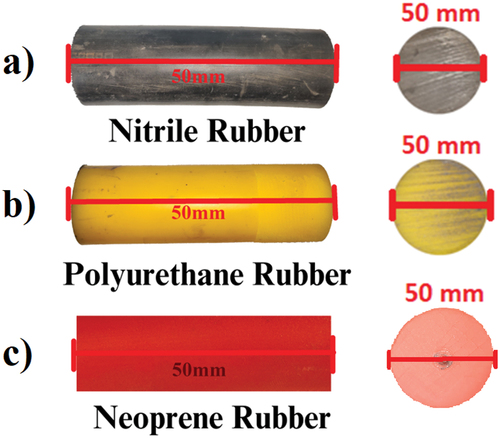
Figure 2. Microstructure of workpiece materials (a) Nitrile Rubber (b) Polyurethane Rubber (c) Neoprene Rubber.
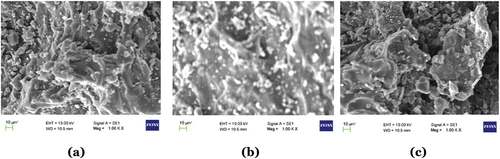
Table 1. Specifications of the cutting tool
Figure 3. Cryogenic cooling assisted machining setup for turning elastomers.
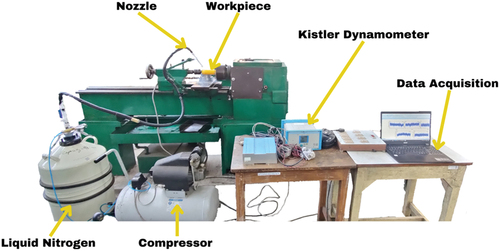
Figure 4. Architecture of BPANN model.
Figure 5. Python sample code for BPANN implementation.
Table 2. Statistical data for selection of learning algorithm
Figure 6. Cutting force v/s lubrication conditions (constant cutting speed– 55m/min).
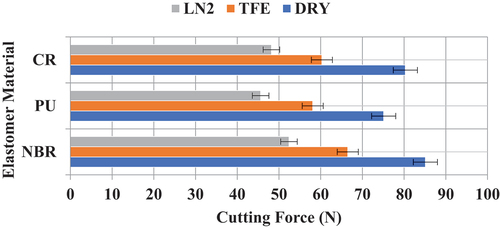
Figure 7. Cutting force v/s lubrication conditions (constant cutting speed– 90m/min).
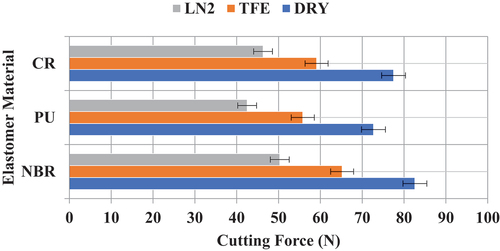
Figure 8. Cutting force v/s lubrication conditions (constant cutting speed − 125m/min).
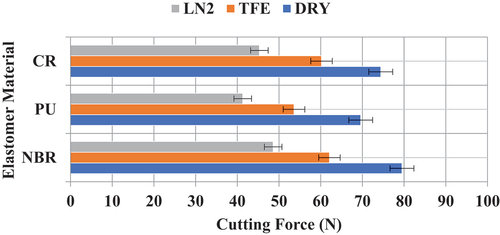
Figure 10. Microscopic image of PU elastomer material under (125 m/min) cutting speed, (0.18mm/rev) feed, (0.50 mm) depth of cut and LN2 conditions.
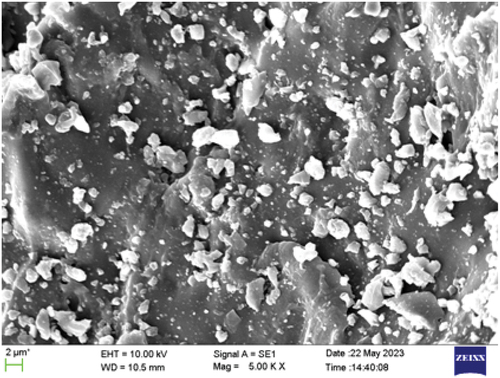
Figure 11. Cutting force (N) signals for PU elastomer material under (125m/min)cutting speed, (0.18mm/rev)feed, (0.50mm)depth of cut and LN2 conditions.
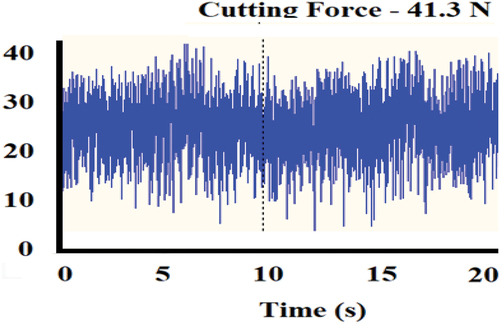
Figure 9. Main effects plot for SN ratios of cutting force.
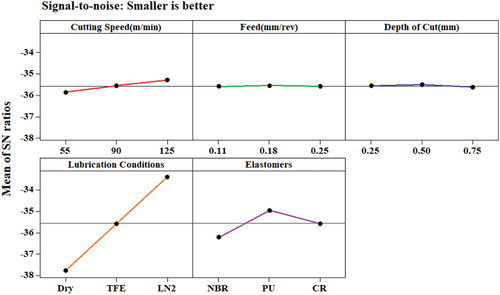
Table 3. ANOVA for cutting force (N)
Figure 12. Surface roughness v/s lubrication conditions (constant cutting speed– 55m/min).
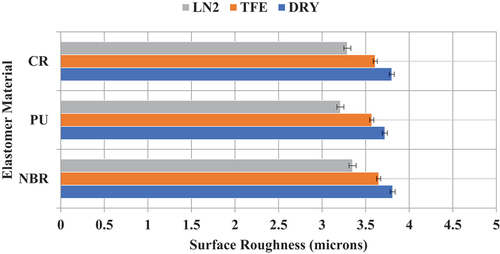
Figure 13. Surface roughness v/s lubrication conditions (constant cutting speed– 90m/min).
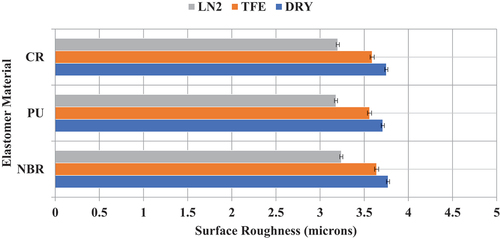
Figure 14. Surface roughness v/s lubrication conditions (constant cutting speed- 125m/min).

Figure 16. Microstructure of turned surfaces of (a) Nitrile Rubber (NBR) (b) Polyurethane Rubber (PU) (c) Neoprene Rubber (CR) under (125m/min)cutting speed, (0.18mm/rev)feed, (0.50mm)depth of cut and LN2 cooling conditions.
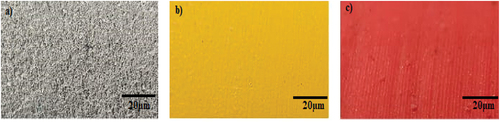
Figure 15. Main effects plot for SN ratios of surface roughness.
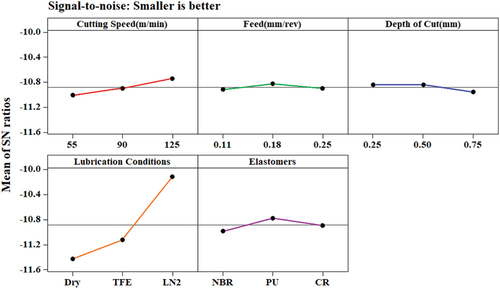
Table 4. ANOVA for surface roughness
Table 5. Training set for BPANN
Table 6. Test set for BPANN prediction
Table 7. Observations of output response
Figure 17. Experimental values compared to BPANN predicted cutting force (N).
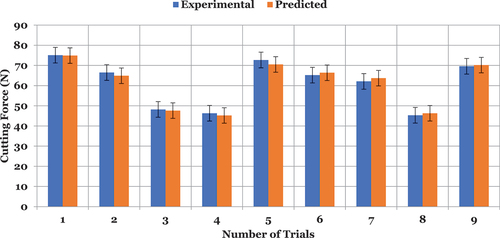
Figure 18. Experimental values compared to BPANN predicted surface roughness (microns).
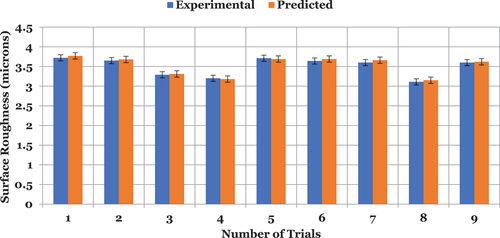
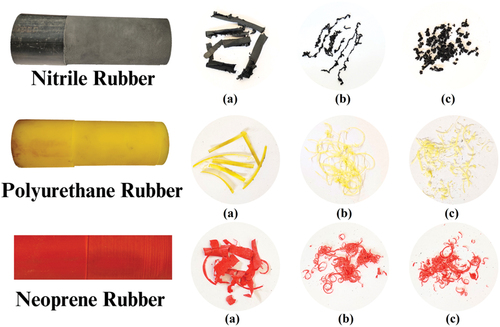
Figure 19. Chips formed during turning of elastomers under different cooling conditions: (a) Dry, (b) TFE, (c) LN2.