
Figures & data
Figure 1. Amman BRT routes (GAM, Citation2021).
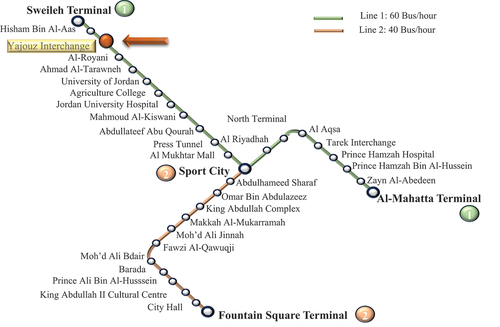
Figure 2. Study methodology flow chart.
Figure 3. Yajouz intersection general layout on BRT line 1.
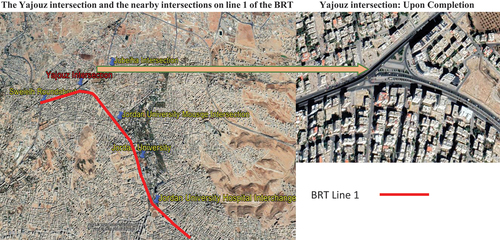
Table 1. Number of lanes by stage and traffic streams
Figure 4. Intersection layout before, during and after construction.
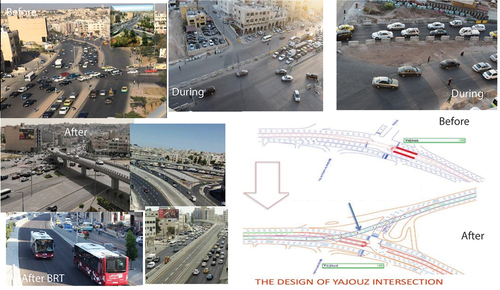
Figure 5. Test segments for the travel time and speed study.
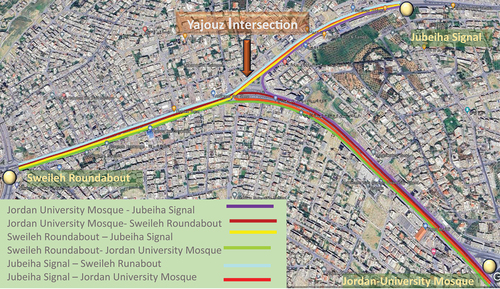
Table 2. Description of air quality index levels
Table 3. The average control delay as a measure of the effectiveness of signalized intersections
Figure 6. Intersection total entry volume at by construction stage.
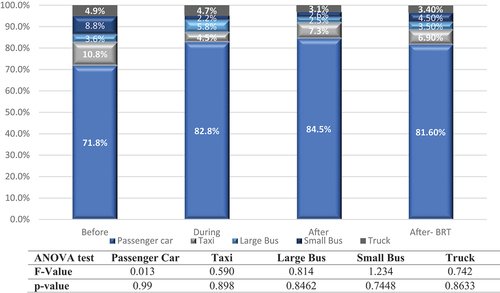
Figure 7. Traffic mix distribution by traffic movement and stage of construction (%).
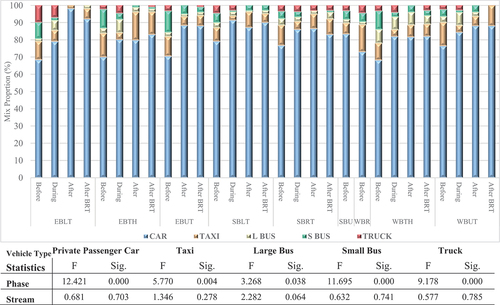
Table 4. Change in public transport ridership over time: peak hourly pax
Table 5. Traffic flow parameters’ variation by stage and related statistical analysis
Table 6. Traffic streams’ delay variation by stage and related statistical analysis
Figure 8. Jordan University Street station: Air quality index, location, daily variation, and monthly variation pattern from 2019 to 2022.
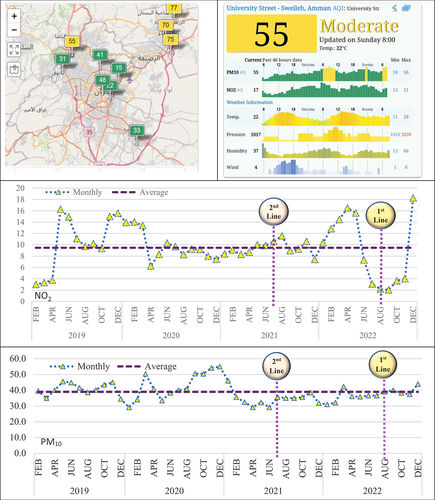
Table 7. Simulated one hour run and the total traffic entry - before construction stage- as measure of effectiveness results
Figure 9. Observed vs simulated delay as MOE validation results.
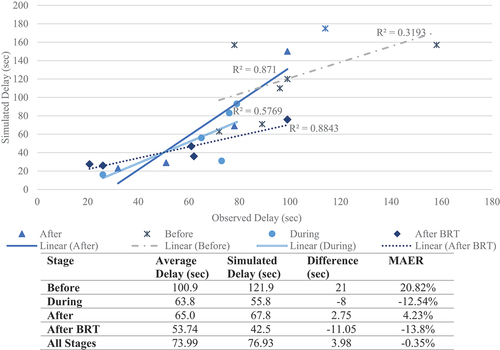
Table 8. The field delay vs modelled delay by stage and traffic streams
Figure 10. Average modelled delays at the intersections with the study area by stage.
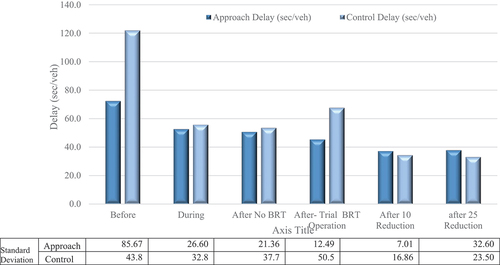
Figure 11. Average modelled traffic stream delays and queue length by stage.
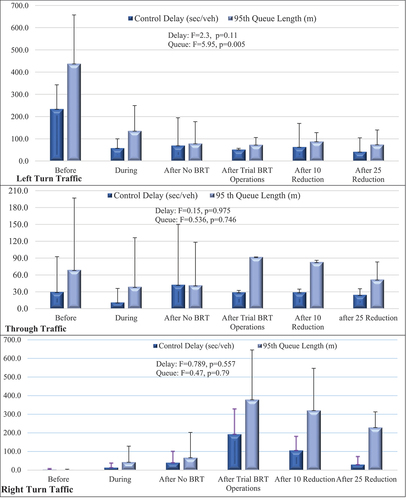
Figure 12. Simulated total and denied delay by stage of construction/operation scenario: sixty-minute simulation.
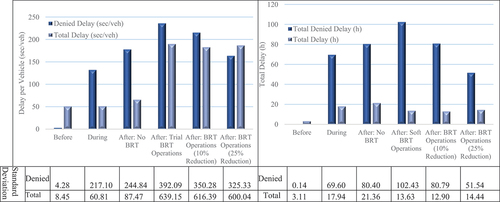
Figure 13. Simulated average speed and Street density by stage of construction/operation scenario.
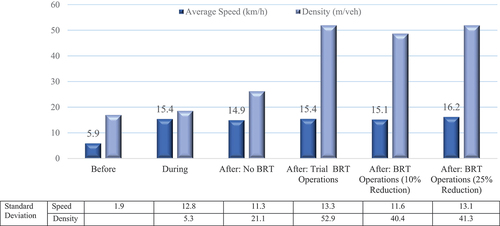
Figure 14. Simulated fuel consumption and stops per vehicle by stage of construction/operation scenario.
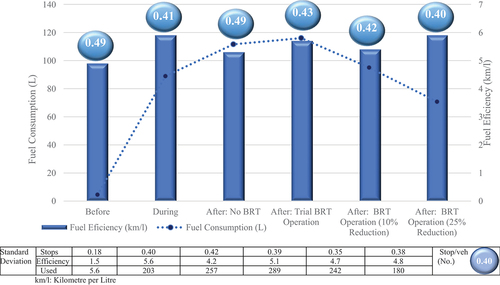
Figure 15. Simulated pollutant emission by stage of construction/operation scenario.
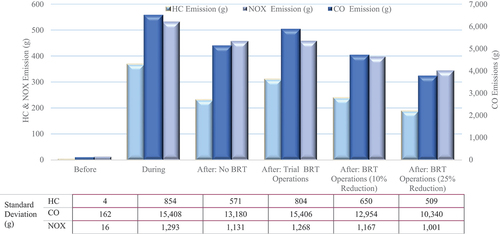
Table 9. Travel time pattern by type and route selection and associated statistical tests
Figure 16. Breakdown of the travel time pattern by traveller type and route selection and associated statistical tests.
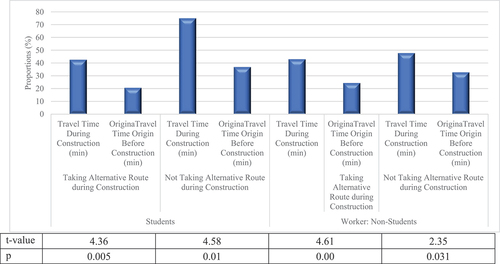
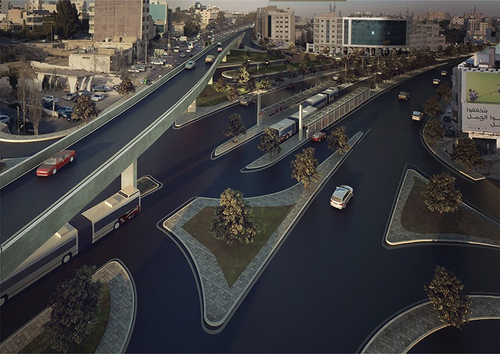
Figure 17. A render of Yajouz intersection upon completion of and BRT operation started.
Data availability statement
Some or all data, models, or code that support the findings of this study are available from the corresponding author upon reasonable request.