Figures & data
Figure 1. A typical work zone layout (Sharma et al., Citation2017).
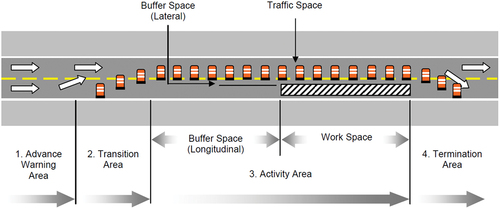
Table 1. Items describing assessed measures on work -zone by category and location and Safety Climate (SC) factors
Figure 2. Amman BRT and Amman-Zarqa BRT link layout.
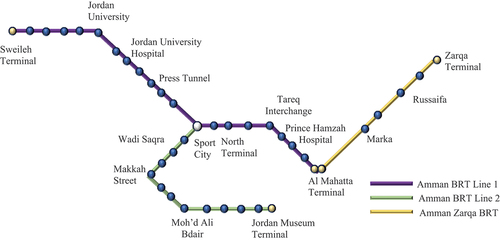
Figure 3. Safety measures assessment in work zones: sites 1–4 for investigated safety factors.
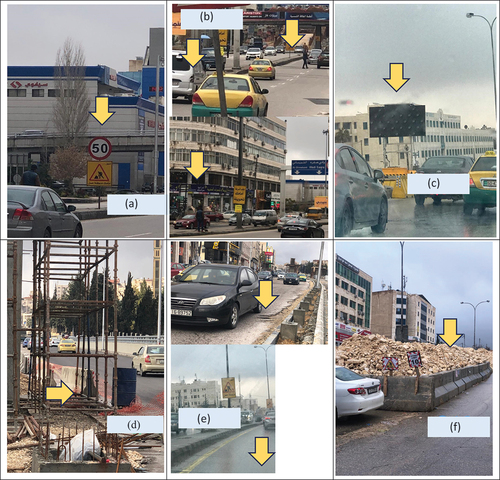
Figure 4. A flow chart of the Research methods.
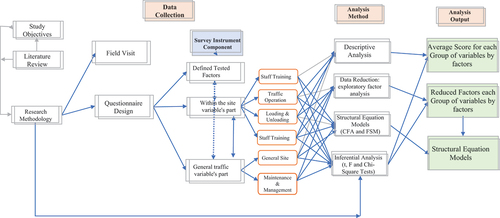
Table 2. Sample characterises
Figure 5. The application rate for measures of the investigated safety factors measures enhancing safety within the site of the project and its surrounding by respondent group.
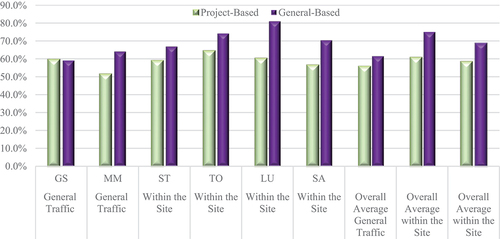
Figure 6. The application rate for measures of the investigated measures of safety factors enhancing safety within the site of the project and its surrounding by respondent group.
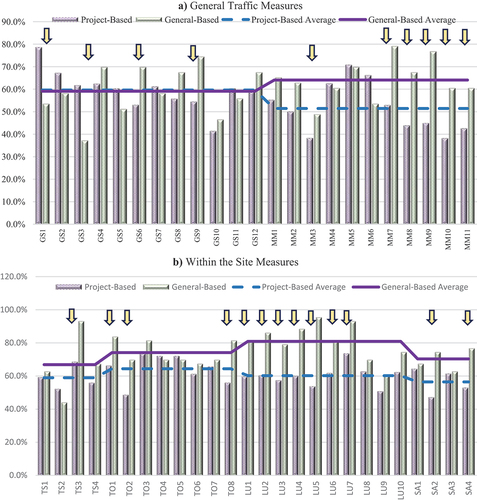
Table 3. Reliability test result for each safety factor measures group by respondent group (Cronbach Alpha coefficients)
Figure 7. The perception of appropriateness of application for measures of the investigated measures of safety factors enhancing safety within the site of the project and its surrounding by respondent group.
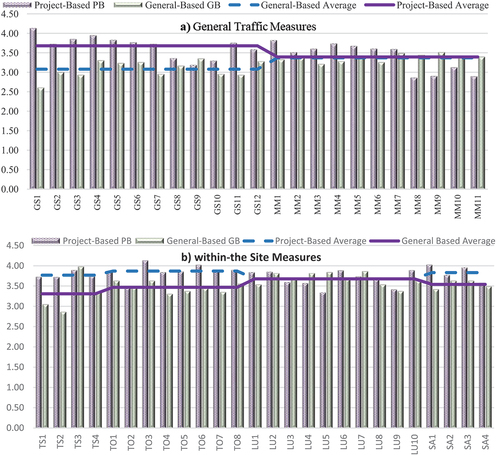
Table 4. Evaluation of road safety measures’ applicability in work zones, considering safety factors and subject sociodemographic variables (average of all responses for each factor)
Table 5a. Factor Analysis Displays Component Loading for each Safety Factor: General Traffic
Table 5b. Factor Analysis Displays Component Loading for each Safety Factor: Within the Site
Table 6a. Explanatory Factor Analysis: Component Loading for each Factor by respondent Category and safety factor: General Traffic
Table 6b. Explanatory Factor Analysis: Component Loading for each Factor by respondent Category and safety factor: Within-the-Site
Table 7. The impact of sociodemographic factors on the extracted factors: the entire data set
Table 8. The impact of sociodemographic factors on the extracted factors by respondent Group
Table 9. Correlation matrix for observed and extracted variables by respondent group
Table 10. CFA results for the 1st and 2nd order Models
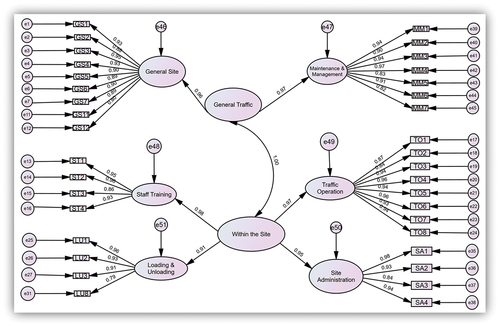
Figure 8. SEM model: 1st order model-six latent variables and thirty-six observed variables.
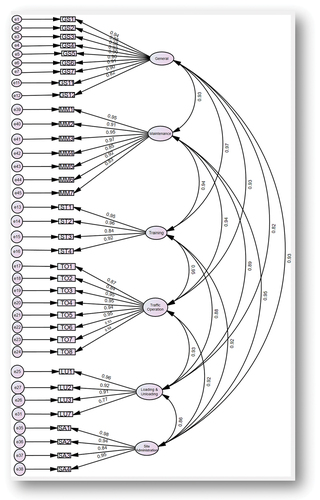
Figure 9. SEM model: 2nd order model - eight latent variables and thirty-six observed variables.