
Figures & data
Figure 1. Flow diagram of the forging traditional processing and inspection process in the wind turbine gear box.
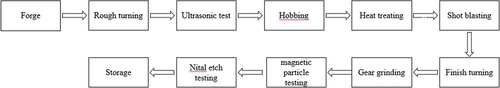
Figure 2. Flow diagram of the forging current processing and inspection process in the wind turbine gear box.
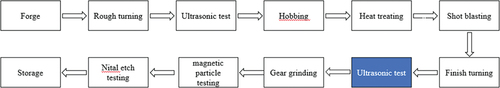
Figure 3. Schematic diagram of the dangerous area prone to cracks of gear tooth.
Figure 4. Diagram of inspection area of straight probes and angle beam probes.
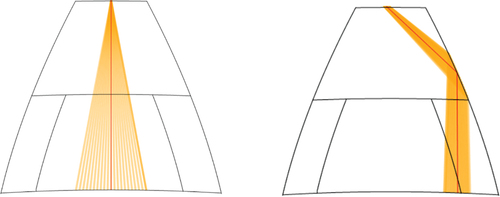
Figure 5. Diagram of inspection area of phased array ultrasonic probe.
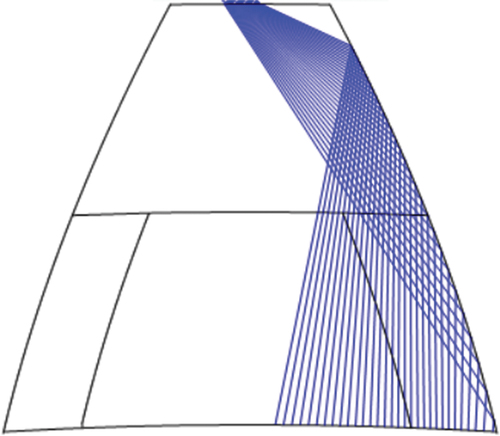
Figure 6. Schematic diagram of fixed tooling for placing the phased array ultrasonic probe.
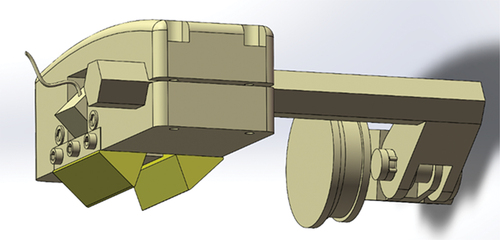
Table 1. PAUT parameters
Figure 7. Structure diagram of delay and sound speed calibration reference block.
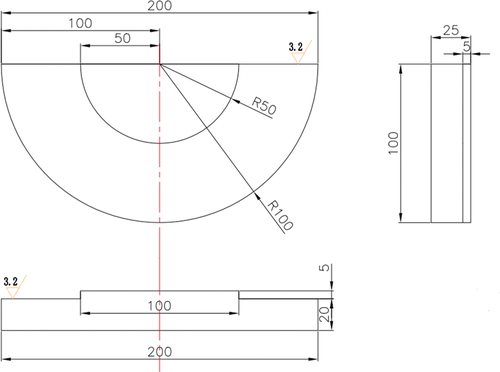
Figure 8. Structure diagram of sensitivity curve setting reference block.
Figure 9. Structure diagram of sensitivity curve correction reference block.
Figure 10. Schematic diagram of simulation block with artificial defects.
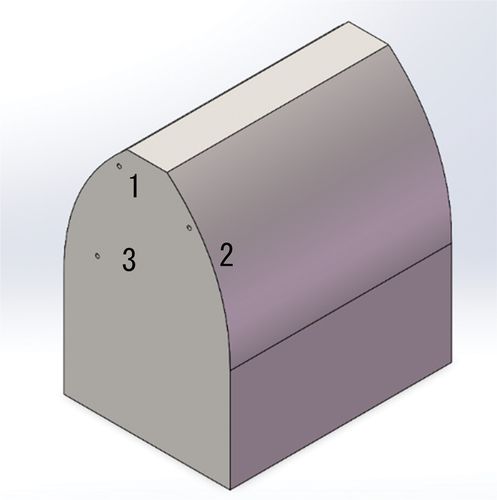
Figure 11. Inspect result representation of PAUT.
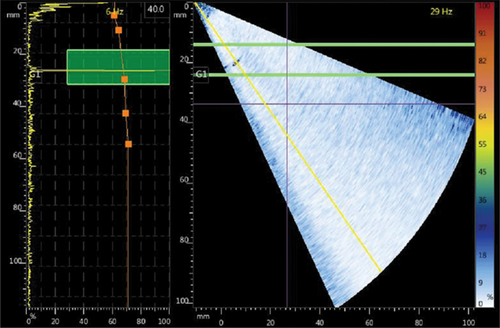
Figure 12. SEM and EDS of broken tooth section.
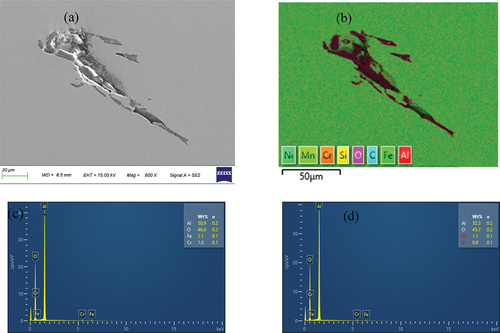
Table 2. Date statistical of the distance from top land and face of the defects