Figures & data
Figure 1. NREL Phase VI wind turbine blade generated in QBlade.
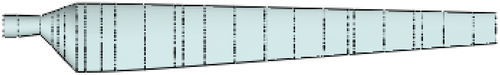
Figure 2. The 2D section views winglet configurations with parameters (a) with cant and arc angle 30°; (b) with cant and arc angle 45°; (c) with cant and arc angle 60°; (d) isometric view.
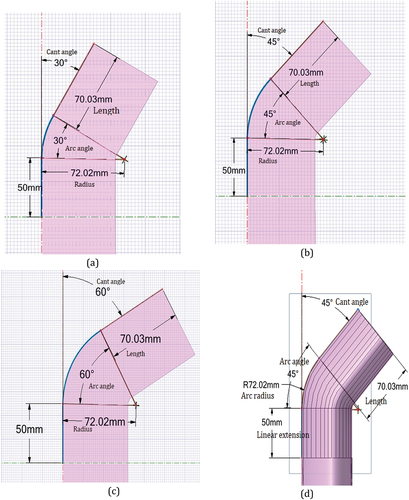
Figure 3. Blade winglet configurations, (a) NREL Phase VI blade with winglet length 70.03 mm & cant angle 30° oriented to the suction side, (b) NREL Phase VI blade with winglet length 70.03 mm & cant angle 45° oriented to the suction side, (c) NREL Phase VI blade with winglet length 70.03 & cant angle 60° oriented to the suction side, (d) benchmark NREL Phase VI blade tip region without winglet.
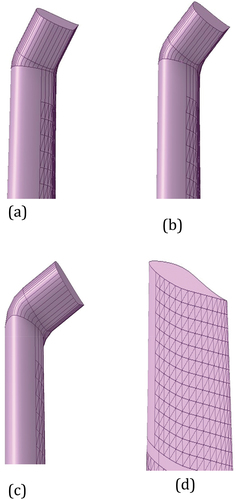
Table 1. The NREL Phase VI rotor: geometry and design parameters (Hand et al., Citation2001)
Table 2. Design parameters and winglet configurations
Figure 4. (a) Physical domain, (b) a rectangular local refinement region around the blade (c) a poly-hexcore domain mesh, (d) blade surface mesh.
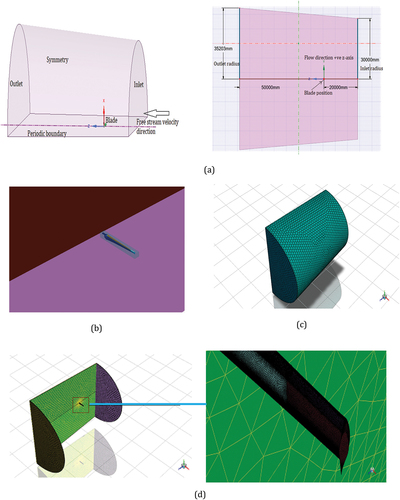
Table 3. Mesh independence test
Figure 5. Comparison of baseline CFD, QBlade prediction, and experimental data (NREL).
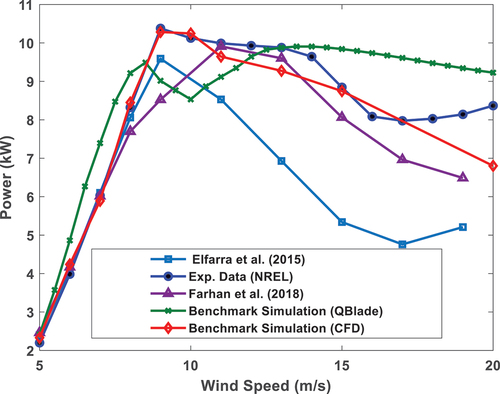
Figure 6. Pressure coefficients from NREL experiment at 7 m/s and CFD simulation comparison.
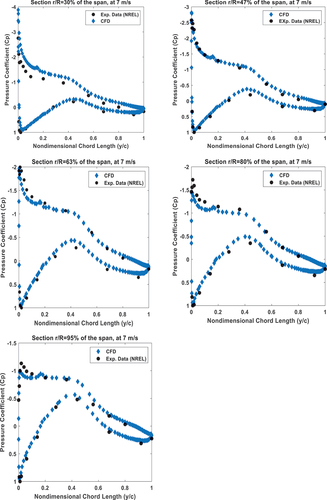
Figure 7. Pressure coefficients from NREL experiment at 9 m/s and CFD simulation comparison.
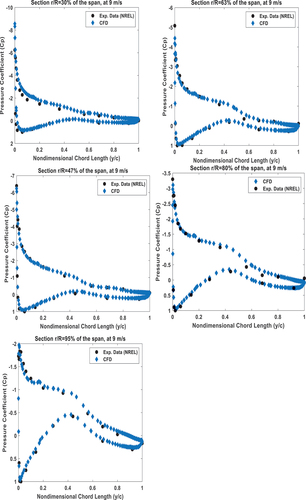
Figure 8. Surface streamline at 7 m/s: benchmark and an enlarged view of 95% of the span.
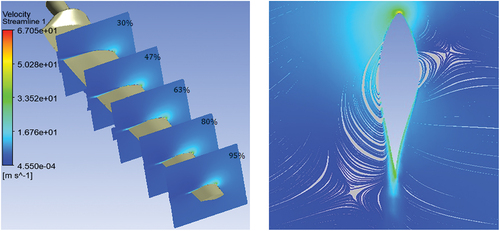
Figure 9. Surface streamline at 9 m/s: benchmark and an enlarged view of 95% of the span.
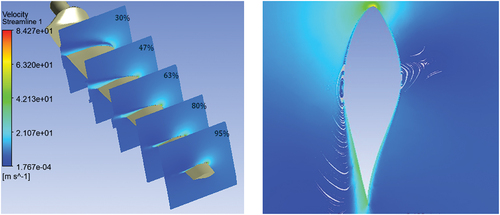
Figure 10. Benchmark blade surface streamline at (a) 13m/s, (b) 15 m/s: an enlarged view of 95% of the span.
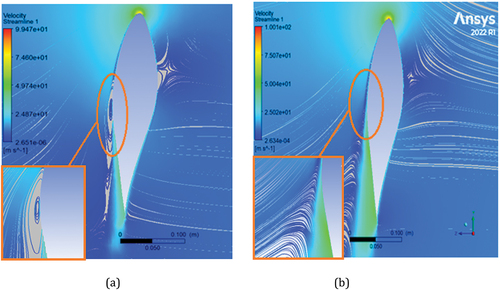
Figure 11. Comparison of the CFD simulated power for the benchmark without winglet and blade with variant winglet configurations.
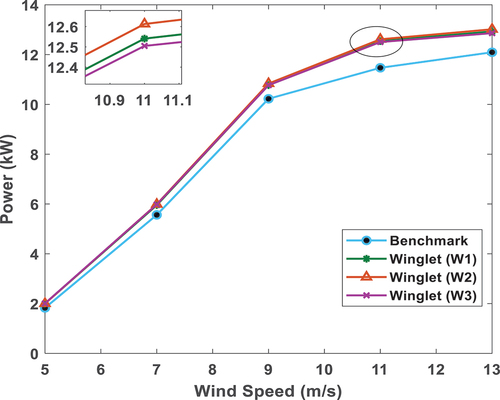
Figure 12. Comparison of the CFD simulated thrust force for the benchmark without winglet and blade with variant winglet configurations.
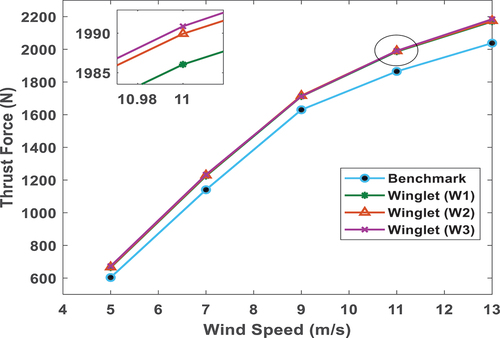
Figure 13. ZX-plane that cuts the blade right at the tip of the trailing edge and the sliced portion an enlarged view.
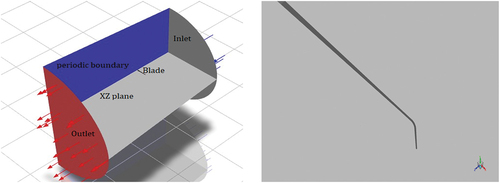
Figure 14. Vorticity magnitude (the tip vortices) benchmark and winglets at 9m/s.
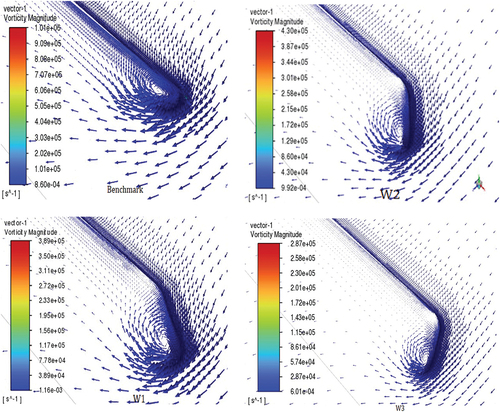
Figure 15. Velocity magnitude, at 9 m/s around tip region: benchmark (left) and blade with winglet W2 (right).
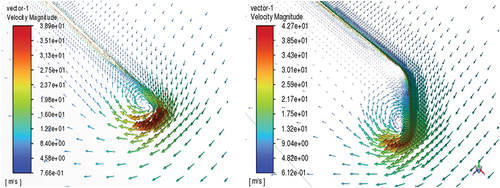
Figure 16. The distribution of axial velocity obtained from the span-wise position r/R = 0.95 to the tip both for the benchmark and winglet cases, at 9m/s.
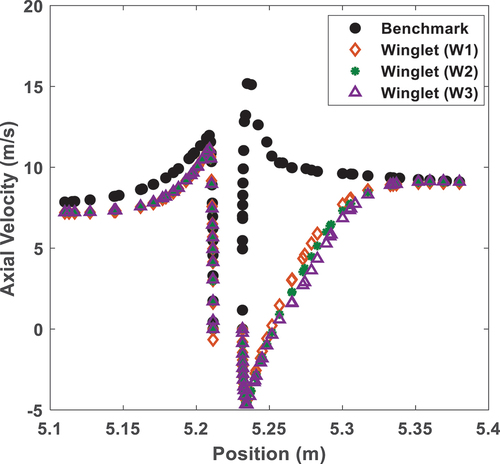
Figure 17. The vorticity distributions obtained from the span-wise position r/R = 0.95 to the tip for the benchmark and winglet cases, at 9 m/s.
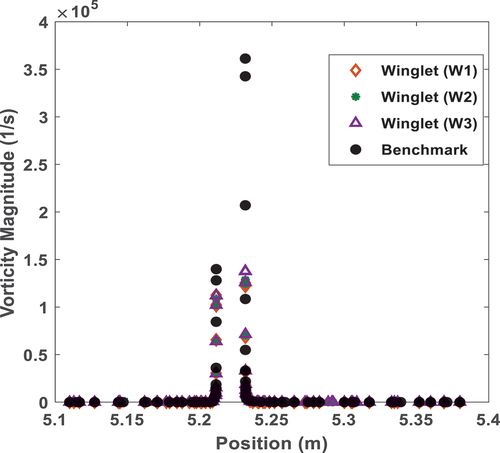
Figure 18. Surface pressure at the tip region at 9 m/s, suction side (a) and pressure side (b).
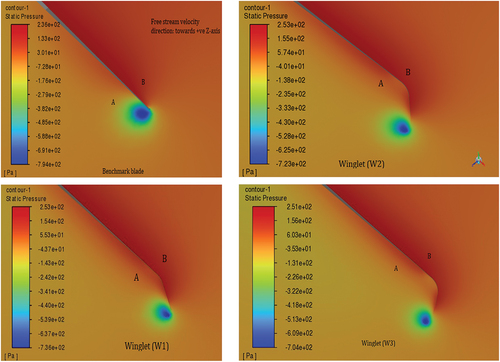
Figure 19. Benchmark and blade with winglets: surface local pressure on the suction (a) and pressure side (b) at section 98% of the span (r = 5.1274) and wind speed of 7m/s.
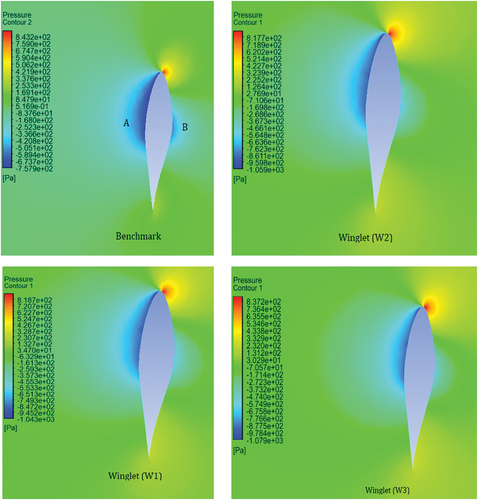
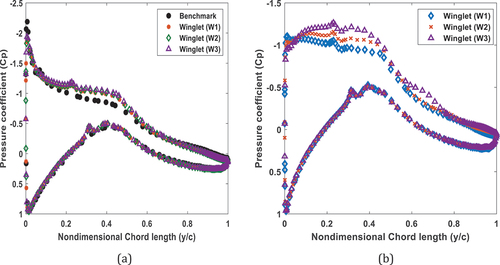
Figure 20. Pressure coefficients of the benchmark and blade with winglets at 9 m/s comparison, (a) at section r = 5.1274m, (b) at section r = 5.2724m.