
Figures & data
Figure 1. Spalling of concrete from the bridge in Karachi, Pakistan (Author’s own picture).
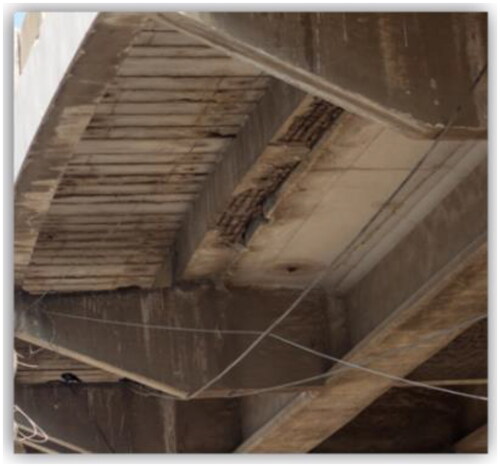
Table 1. Mortar composition used in the study.
Figure 2. (a) Special divided bar. (b) PVC mold and location of steel in mold.
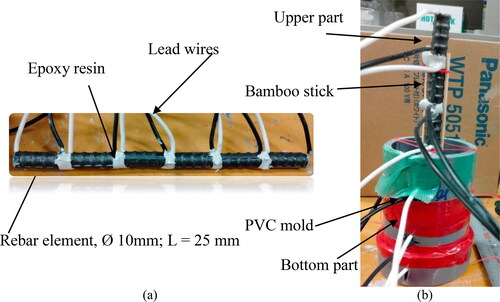
Figure 3. (a) Structural element with full cover thickness. (b) 2-A and 2-B with full cover thickness of 20 mm; without and with 15 kg/m3 Cl− ions.
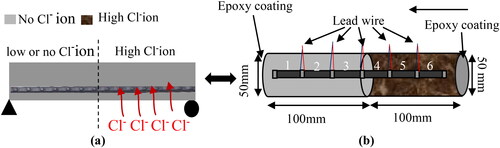
Figure 4. (a) Structural element with partial cover thickness. (b) 1-A and 1-B with the partial cover thickness of 20 mm and 7.5 mm; without and with 15 kg/m3 Cl− ions.
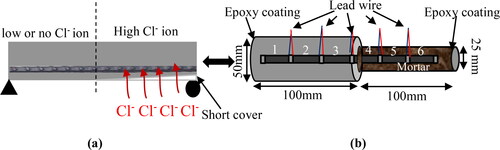
Table 2. Mortar mixes and specimen details
Figure 5. Schematic setup of macrocell current density measurement.
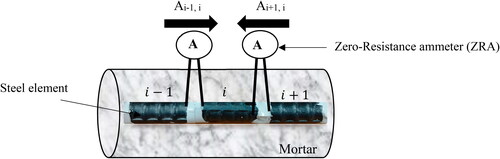
Figure 6. Schematic setup of the polarization resistance measurement.
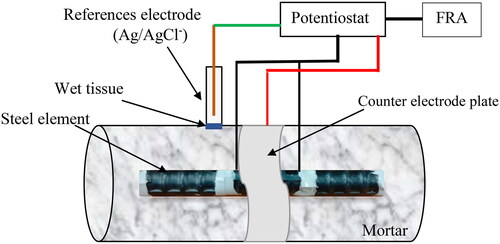
Figure 7. Schematic setup of the polarization curve measurement.
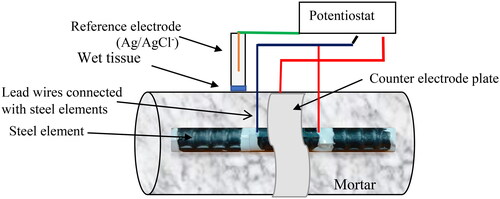
Figure 8. (a) Variation of corrosion current densities for 1-A. (b) Variation of corrosion current densities for 1-B.
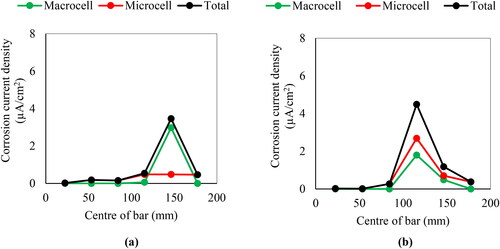
Figure 9. Comparison of W/C for 1-A an1-B.
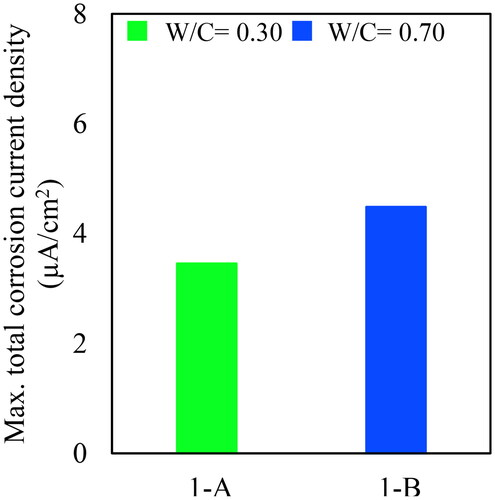
Figure 10. Visual observation of steel bars after breaking for 1-A and 1-B.
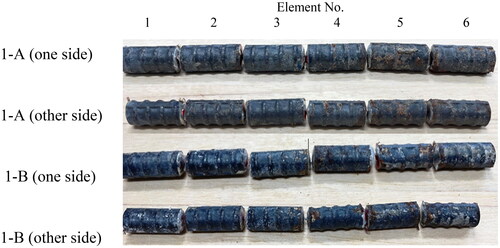
Figure 11. Electric resistivity different mortar mixes.
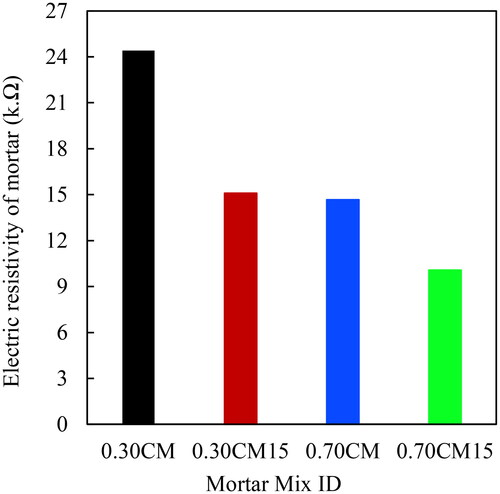
Figure 12. Comparison of anodic polarization curves w.r.t mortar quality for 7.5 mm cover thickness subjected to Cl− ion.
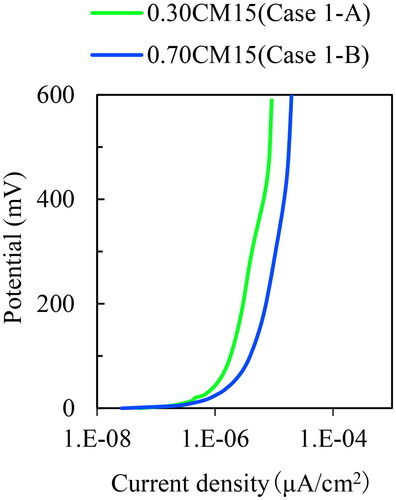
Figure 13. Comparison of cathodic polarization curves w.r.t mortar quality for 7.5 mm cover thickness subjected to Cl− ion.
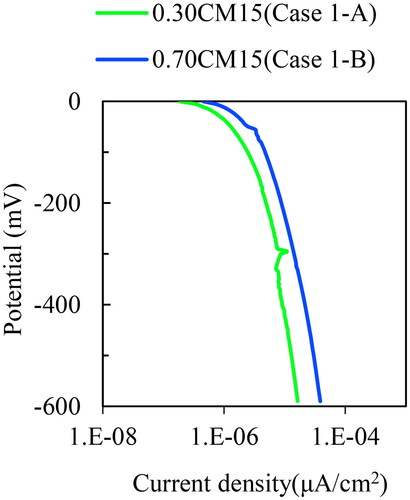
Figure 14. Effect of full cover thickness (2-A & 2-B) and partial cover thickness (1-A & 1-B) on total corrosion current density w.r.t W/C of 0.30 and 0.70, respectively.
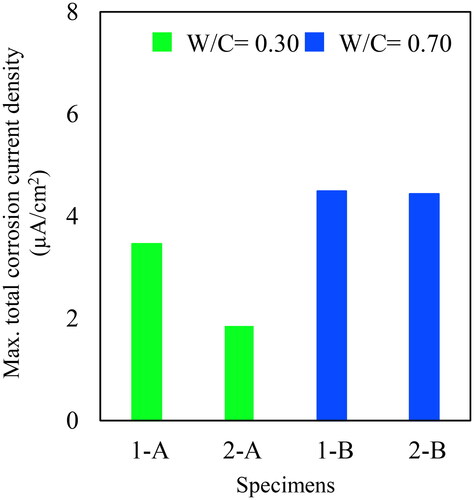
Figure 15. (a) Variation of corrosion current densities for 2-A. (b) Variation of corrosion current densities for 2-B.
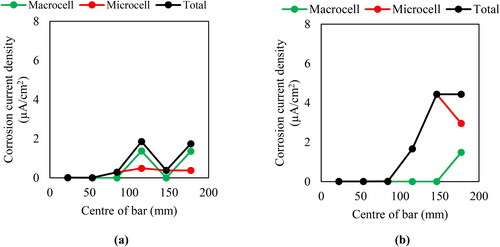
Figure 16. Visual observation of steel bars after breaking for 2-A and 2-B.
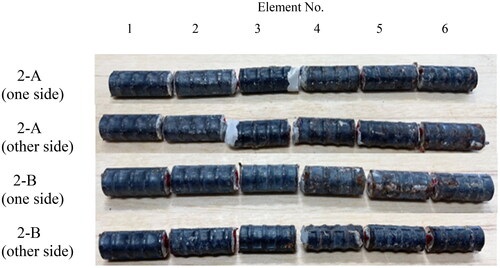
Figure 17. Comparison of anodic polarization curves of 20 mm cover depth and 7.5 mm cover depth for 0.30CM15 and 0.70CM15.
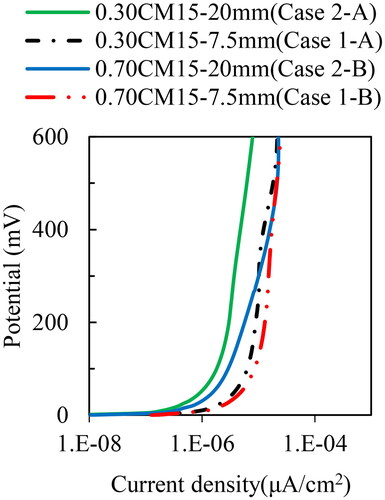
Figure 18. Comparison of cathodic polarization curves of 20 mm cover depth and 7.5 mm cover depth for 0.30CM15 and 0.70CM15.
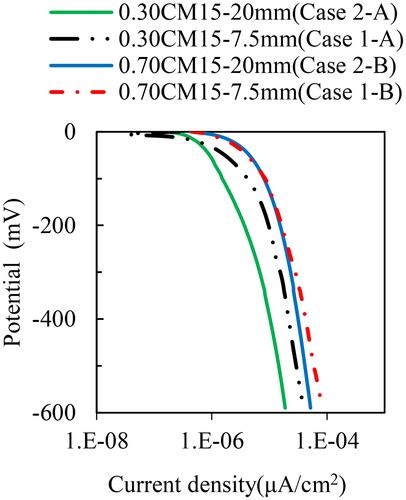
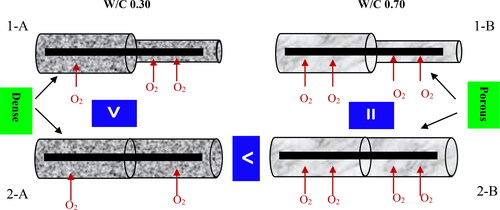
Figure 19. Influence of partial cover thickness on oxygen permeability.
Note: The inequality sign indicates the magnitude of the corrosion current density.
Data availability statement
All the data will be available upon request.