
Figures & data
Figure 1. The SPH problem domain of continuous particles in SCC.
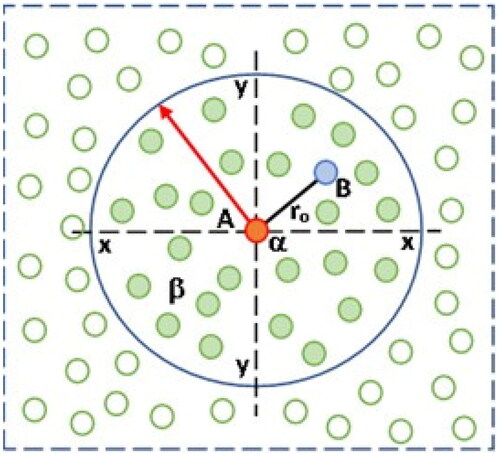
Figure 2. The Orimet test method geometry.
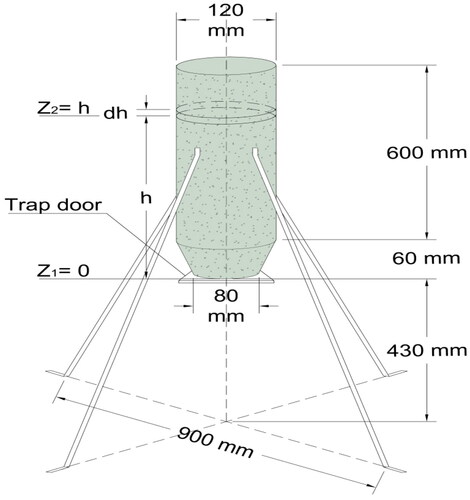
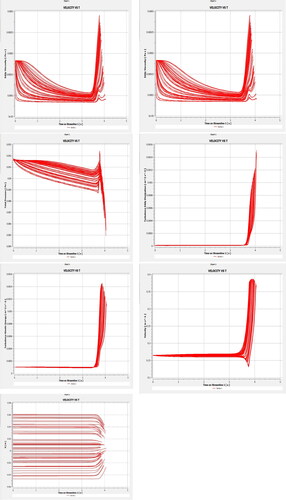
Figure 3. 0%C mixed with 100%F case multiphysics model with Orimet flow time (OFT) of 6 s.
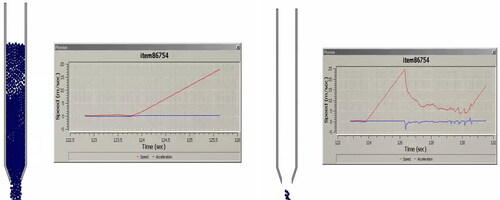
Figure 4. 40%C mixed with 60%F case multiphysics model with Orimet flow time (OFT) of 5 s.
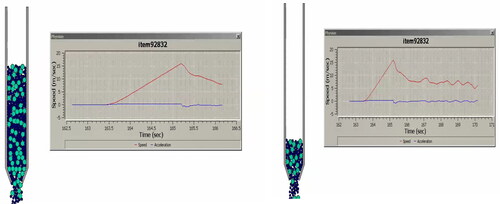
Figure 5. 45%C mixed with 55%F case multiphysics model with Orimet flow time (OFT) of 9 s.
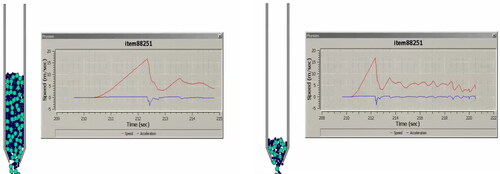
Figure 6. 50%C mixed with 50%F case multiphysics model with Orimet flow time (OFT) of 12 s.
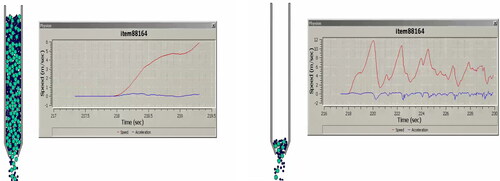
Figure 7. 55%C mixed with 45%F case multiphysics model with Orimet flow time (OFT) of 11 s.
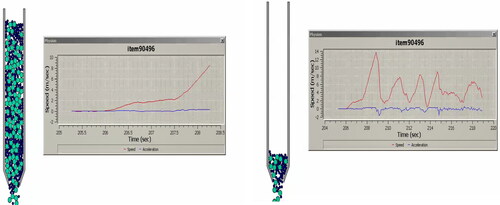
Figure 8. 60%C mixed with 40%F case multiphysics model with Orimet flow time (OFT) of 12 s.
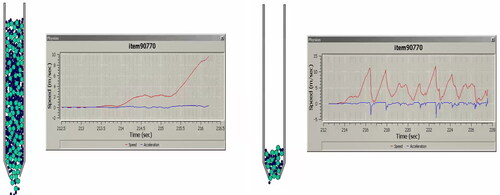
Figure 9. 100%C mixed with 0%F case multiphysics model with Orimet flow time (OFT) of 20 s.
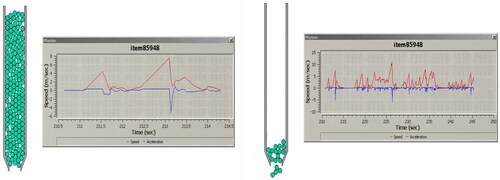
Figure 10. Discretization of the Orimet apparatus.
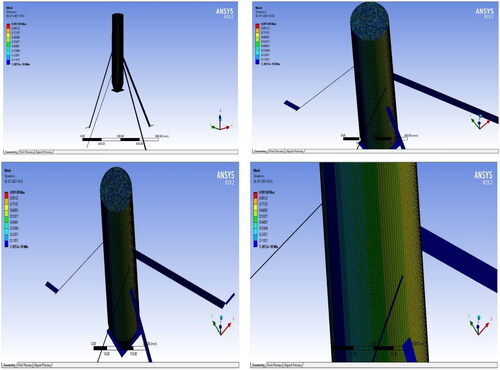
Figure 11. Orimet flow velocity and energy properties for the optimized mix.
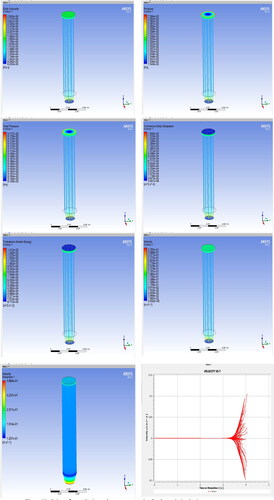
Figure 12. Graphical representation of the optimized flow energy and velocity properties.
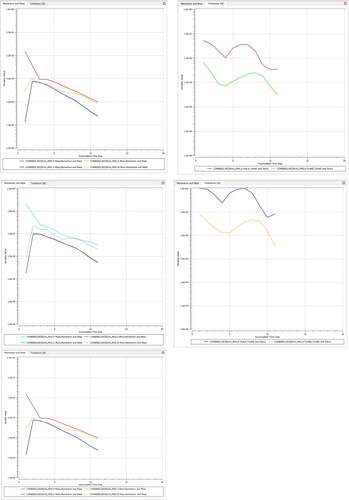
Figure 13. Flow interparticle properties and on the wall.
Data availability statement
The data supporting this research work is available on reasonable request from the corresponding author.