
Figures & data
Figure 1. Fibonacci sequence in the family tree of a drone (adapted from Koshy, Citation2017).
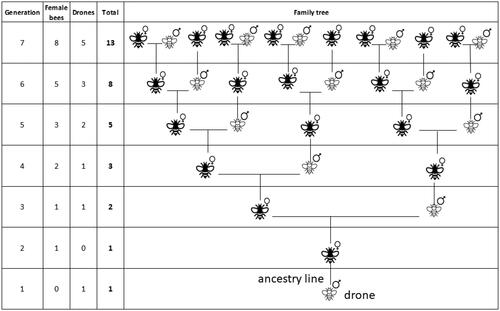
Table 1. Metaheuristics inspired by Fibonacci.
Table 2. Properties of Gear Pumps A and B.
Table 3. Experimental design for BAF.
Table 4. Example of BAF for a population of 51.
Table 5. BAF results of the initial runs (10 independent runs).
Table 6. Descriptive statistics of E48, E49, E50, E68, E69 and E70 (50 runs).
Figure 2. EDBA and BAF results (Gear Pump A).
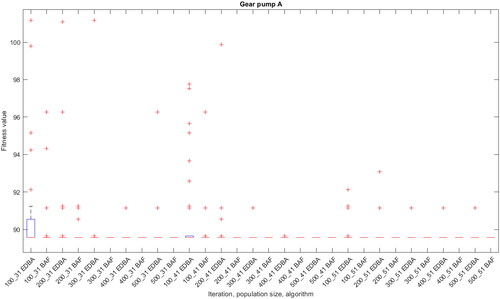
Figure 3. EDBA and BAF results (Gear Pump B).
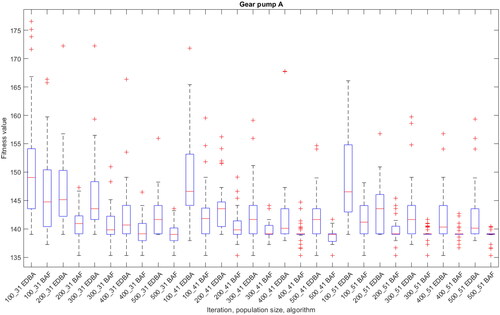
Table 7. Gear Pump A best results (EDBA and BAF).
Table 8. Gear Pump B best result (EDBA and BAF).
Table 9. EDBA and BAF average results for Gear Pump A.
Table 10. EDBA and BAF results for Gear Pump B.
Figure 4. Dunn–Sidak test results (Gear Pump A).
Group 1 = 100_31 EDBA, Group 2 = 100_31 BAF, Group 3 = 200_31 EDBA, Group 4 = 200_31 BAF, …, Group 29 = 500_51 EDBA, Group 30 = 500_51 BAF.
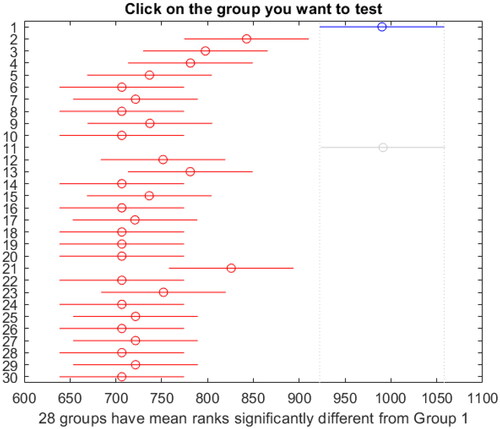
Figure 5. Dunn–Sidak test results (Gear Pump B).
Group 1 = 100_31 EDBA, Group 2 = 100_31 BAF, Group 3 = 200_31 EDBA, Group 4 = 200_31 BAF, …, Group 29 = 500_51 EDBA, Group 30 = 500_51 BAF.
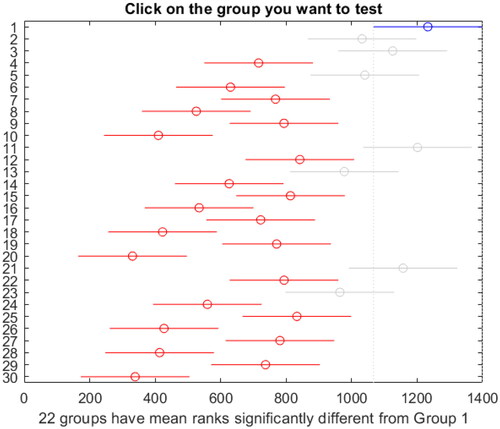
Table 11. Kruskal–Wallis test results (Gear Pump A).
Table 12. Kruskal–Wallis test results (Gear Pump B).
Figure 6. EDBA and BAF boxplot final results.
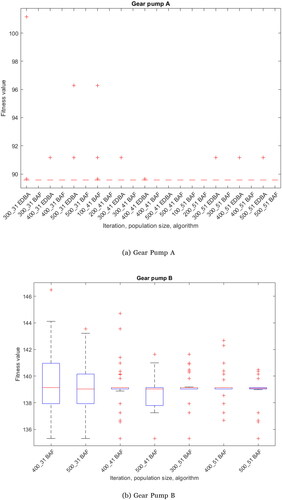
Table 13. Kruskal–Wallis final results (Gear Pump A).
Table 14. Kruskal–Wallis final results (Gear Pump B).
Figure 7. PEI (histogram) and Average Disassembly Time (dot): Higher PEI and Lower Time are Better. Higher PEI represents highest performance and Lower time represents best disassembly time (desirable).
Note: The line shows the highest PEI; EDBA is represented by blue and BAF by purple colour
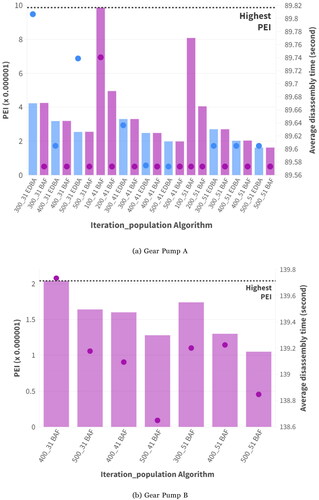
Table A1. Gear Pump A normality test.
Table A2. Gear Pump B normality test.
Table A3. Gear Pumps A and B homogeneity test.
Table B1. PEI values – Gear Pump A.
Table B2. PEI values – Gear pump B.