
Figures & data
Table 1. Comparison of various channel fabrication techniques.
Table 2. Comparison of circular microchannel fabrication methods.
Figure 1. Copper wire based mold for straight channel.
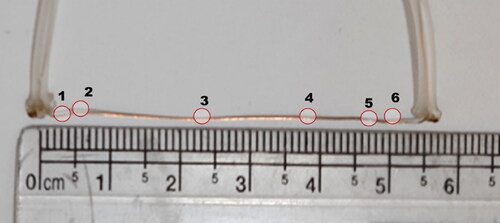
Figure 2. Copper wire mold image (a) SEM image (Zoom 200X) (b) SEM image (Zoom 1000X) (c) AFM image (maximum surface roughness 134.4 nm).
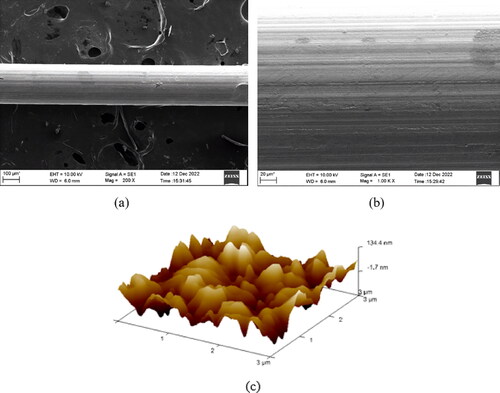
Figure 3. SEM image of rubber tube cross-section.
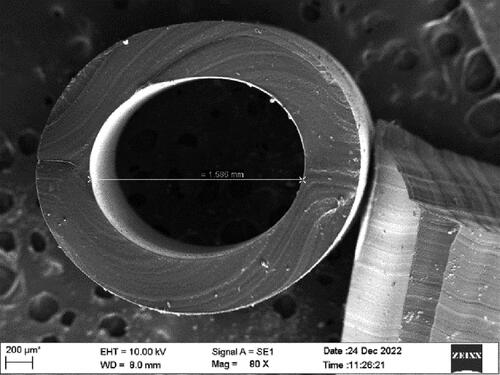
Figure 4. Plastic container for optimal use of PDMS: (a) Top view, and (b) Box in the open state (Tiwari et al., Filed on 18th December Citation2023).
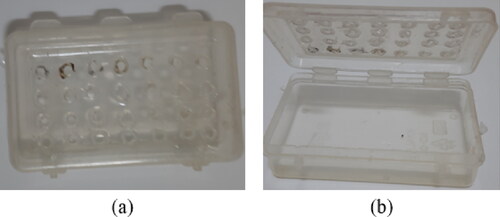
Figure 5. Plastic container with a layer of aluminum foil (Tiwari et al., Filed on 18th December Citation2023).
Figure 6. (a) The channel mold attached to the plastic box cover (b) Box filled with PDMS.
Figure 7. PDMS bulk with microchannel and tubing.
Figure 8. (a) Mesh model (b) Straight channel model and (c) Channel model with bending.
Figure 9. Velocity profile in the channel at various distance starting at 0 from inlet (a) Straight channel, and (b) Channel model with bending.
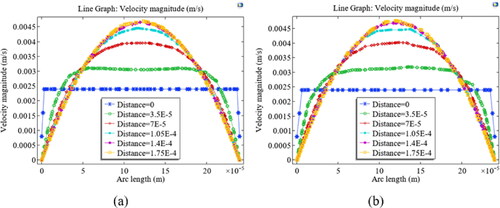
Figure 10. Velocity surface plot at 1 mm distance from the straight channel inlet.
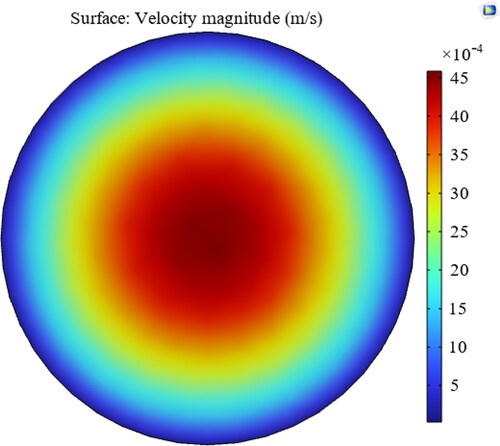
Figure 11. Pressure drop across the channel (a) Straight, and (b) With bends.
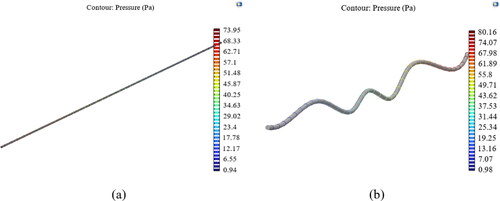
Figure 12. Poincaré map at the outlet of the straight channel (a) Time 11.70s (b) Time 11.75s, and (c) Time 20.00s.
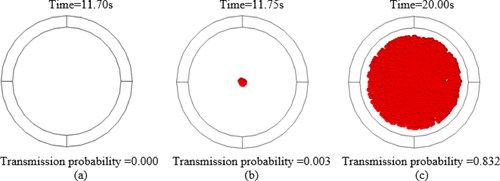
Figure 13. Poincaré map at the outlet of the channel with bending (a) Time 11.65s (b) Time 11.70s, and (c) Time 20.00s.
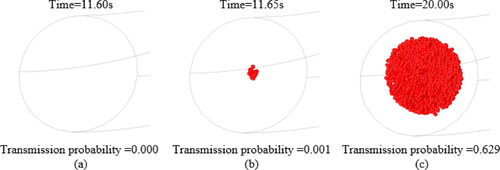
Figure 14. Residence time testing of channel (a) Empty channel (b) Half-filled channel, and (c) Completely filled.
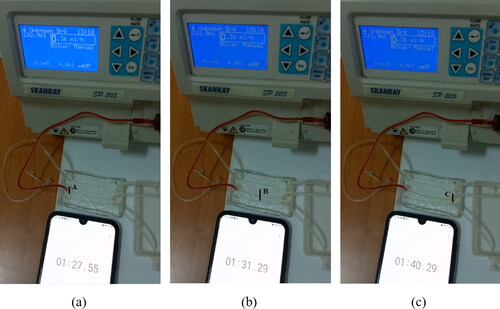
Figure 15. SEM image of channel cross-section.
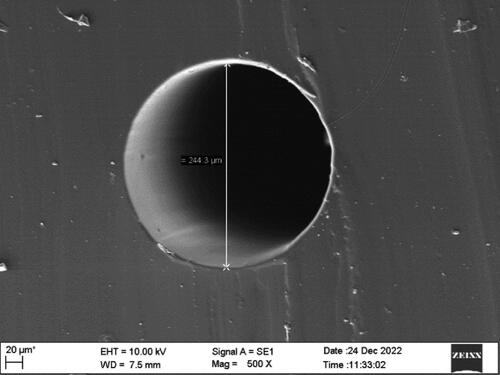
Table 3. Microfluidic channel and their applications.