
Figures & data
Figure 1. Examples of microscopic images: (a) normal blood microscopic image, (b) blood microscopic image with leukemia (Gupta et al., Citation2018, Citation2020).
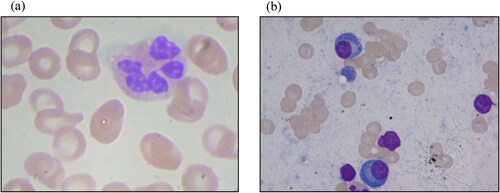
Figure 2. Block diagram of the whole process.
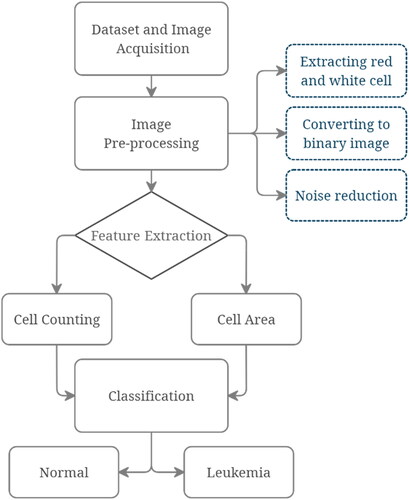
Figure 3. Example of the feature matrix and the label vector used in this work.
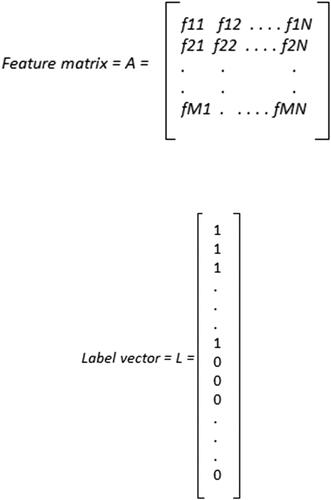
Figure 4. Original microscopic image and the red, green, and blue planes: (a) original microscopic image. (b) Red plane from the original image, (c) green plane from the original image, (d) blue plane from the original image.
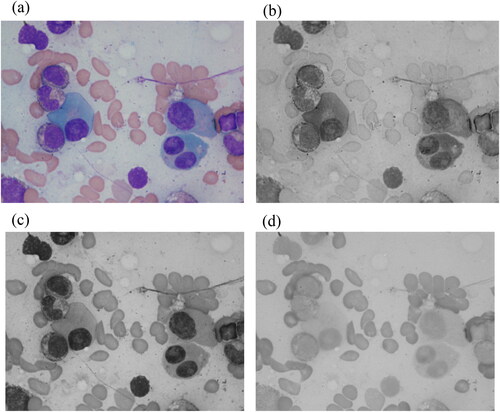
Figure 5. Image after converting to binary, the right top image shows the WBCs, and the bottom image shows the RBCs.
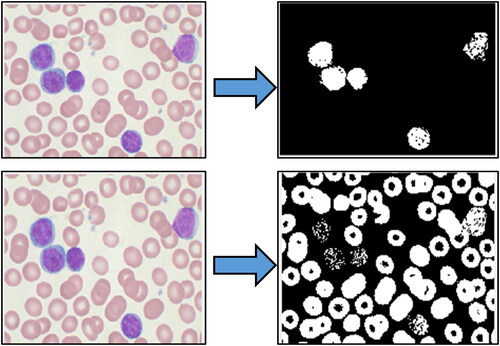
Figure 6. Steps of extracting the WBCs.
Figure 7. GUI shows an example of classifying the input image into “normal.”
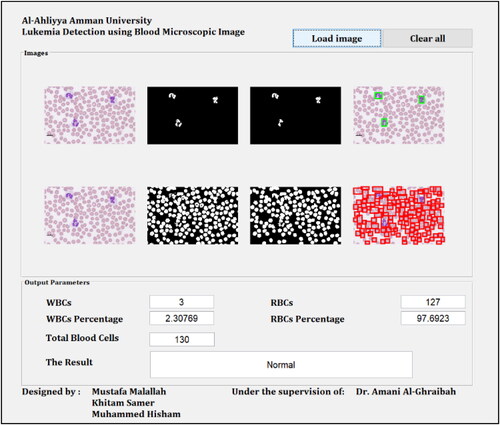
Figure 8. GUI shows an example of classifying the input image into “leukemia.”

Figure 9. Average area of WBCs in each image in the dataset.
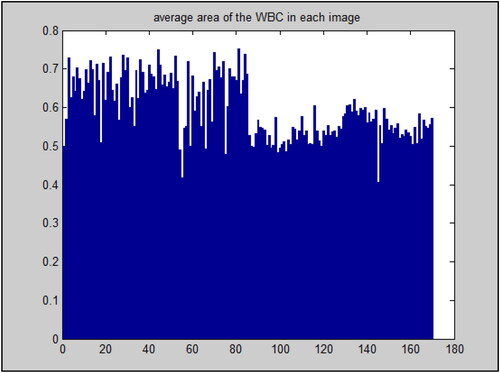
Table 1. Confusion matrix.
Table 2. Confusion matrix of the classification using cell count.
Table 3. Confusion matrix of classifying the images using cell area.