
Figures & data
Figure 1. Study area showing the portion of the lake.
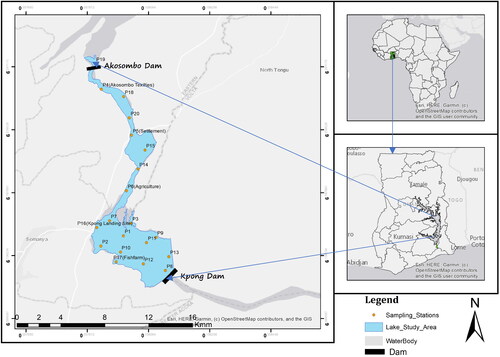
Table 1. Summary statistics of the physical and chemical parameters of the study area.
Figure 2. (a) Remote sensing reflectance of Landsat band and in-situ measured Chl-a concentration for 17 December 2022. (b) Remote sensing reflectance of Landsat band and in-situ measured Chl-a concentration for 15 March 2023.
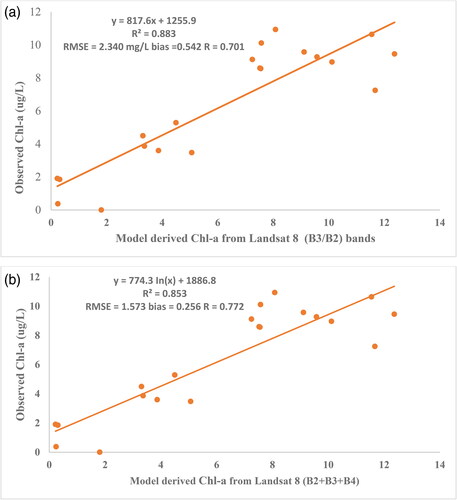
Table 2. Equations for regression models for Chl-a, turbidity, and TSS (using the blue, green and red bands, i.e. B2, B3 and B4, respectively).
Figure 3. (a) Remote sensing reflectance of Landsat band and in-situ measured TSS concentration for 17 December 2022. (b) Remote sensing reflectance of Landsat band and in-situ measured TSS concentration for 15 March 2023.
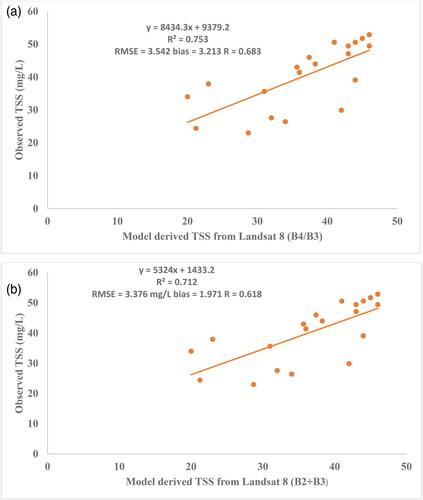
Figure 4. (a) Remote sensing reflectance of Landsat band and in-situ measured turbidity concentration for 17 December 2022. (b) Remote sensing reflectance of Landsat band and in-situ measured turbidity concentration for 15 March 2023.
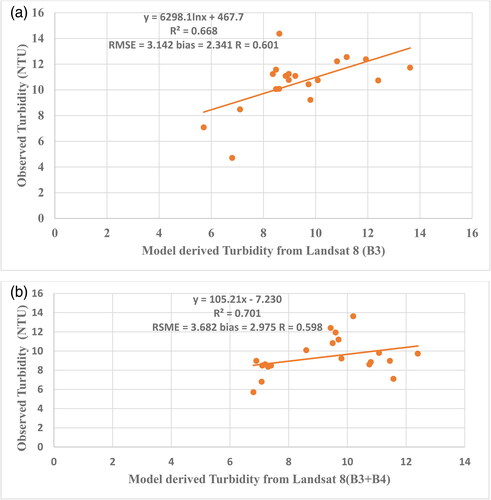
Table 3. Statistics of validation results for in-situ and estimated water quality parameters.
Figure 5. (a) Trends of observed and sensor-estimated Chl-a concentration for the first period. (b) Trends of observed and sensor-estimated Chl-a concentration for the second period.
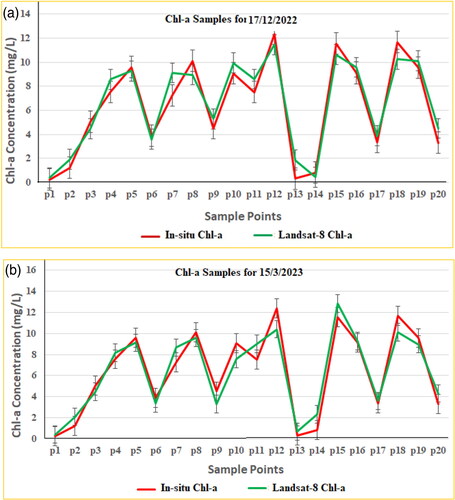
Figure 6. (a) Trends of observed and sensor-estimated TSS concentration for the first period. (b) Trends of observed and sensor-estimated TSS concentration for the second period.
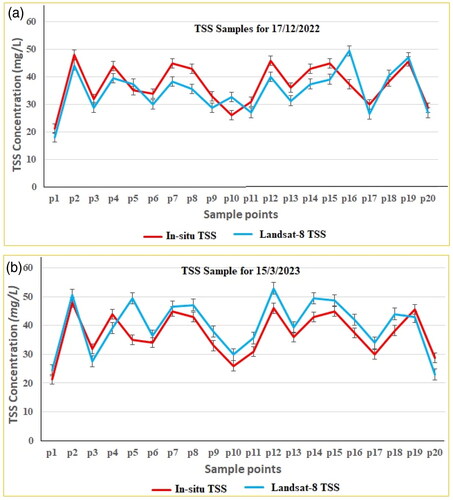
Figure 7. (a) Trends of observed and sensor-estimated turbidity concentration for the first period. (b) Trends of observed and sensor-estimated turbidity concentration for the second period.
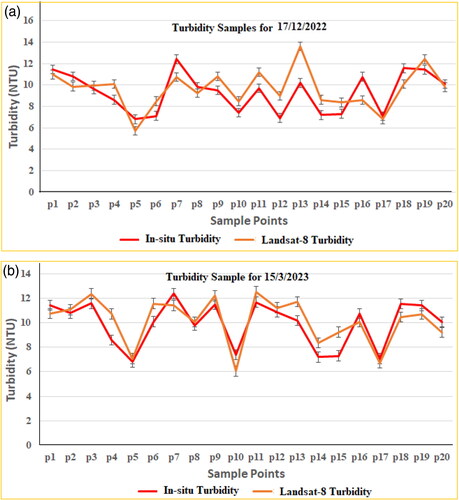
Figure 8. (a) In-situ and estimated Chl-a distribution on 17 December 2022. (b) In-situ and estimated Chl-a distribution on 15 March 2023.
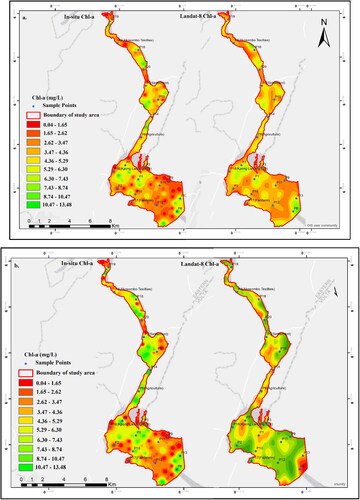
Figure 9. (a) In-situ and estimated TSS distribution on 17 December 2022. (b) In-situ and estimated TSS distribution on 15 March 2023.
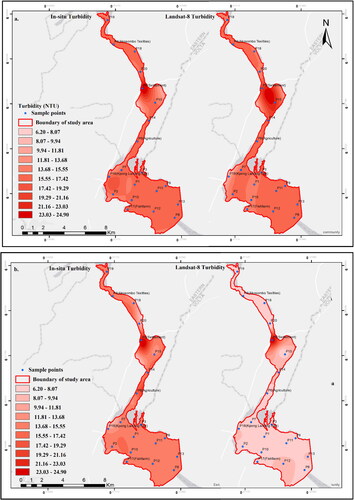
Figure 10. (a) In-situ and estimated turbidity distribution on 17 December 2022. (b) In-situ and estimated turbidity distribution on 15 March 2023.
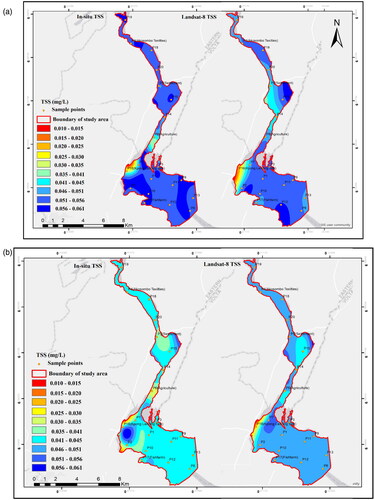
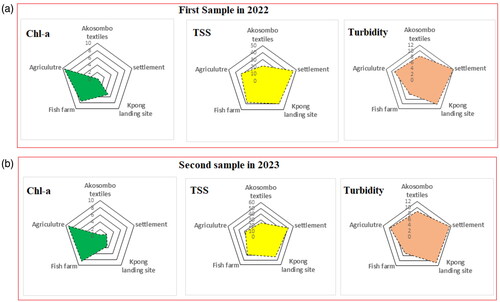
Figure 11. (a) Spatial extent of Chl-a, TSS and turbidity at five different land use sites. (b) Spatial extent of Chl-a, TSS, and turbidity at five different land use sites.
Data availability statement
The datasets generated during/or analyzed during the current study are available from the corresponding author upon reasonable request.