
Figures & data
Figure 1. The experimental Kyzylzharma groundwater well field study area at Kyzylorda, Kazakhstan, in the Syr Darya Artesian Groundwater Basin.
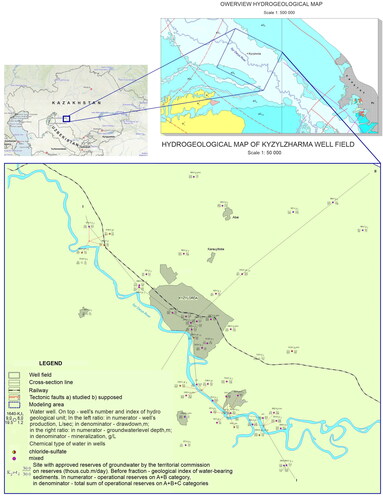
Table 1. Representative hydrogeological cross-section of the Kyzylzharma groundwater well field and conceptual schematization for the model simulations.
Figure 2. Grid design for simulations of the studied Kyzylzharma groundwater well field.
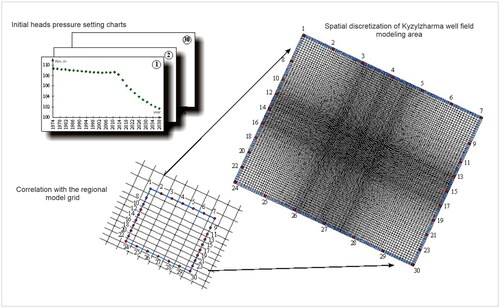
Figure 3. Graphical representation of the hydro chemical facies and factors controlling the water chemistry: a) Durov diagram; b) Piper plot.
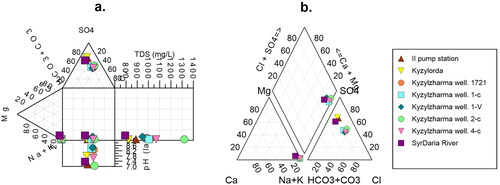
Table 2. Syr Darya water quality.
Figure 4. Transmissivity of the different weakly permeable geologic layers.
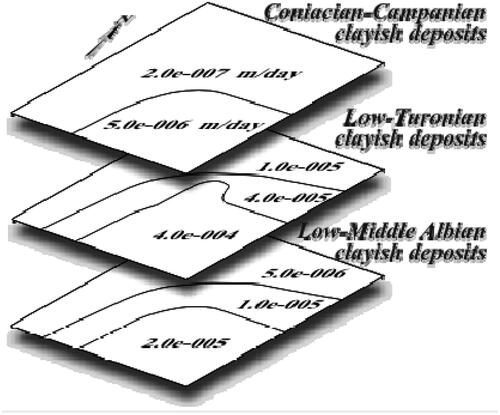
Figure 5. Comparison between calculated and observed heads for steady-state conditions (time step = 1 day, 1974).
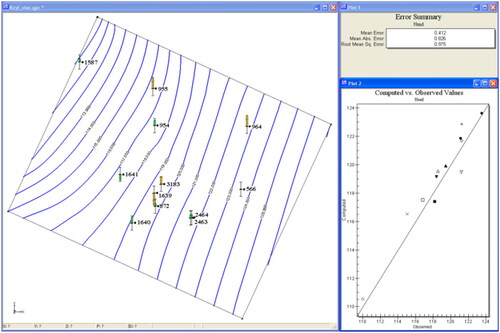
Figure 6. Calculated groundwater levels of the Upper Turonian aquifer from the steady state calibration (1974).
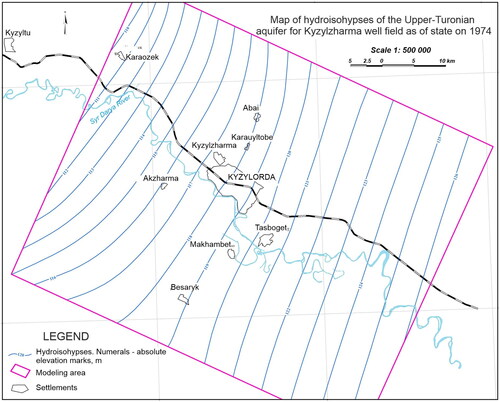
Table 3. Long-term groundwater balances based on steady state calibration for 01/01/1974.
Figure 7. Calculated non-steady state groundwater levels for the Upper Turonian aquifer in 2010.
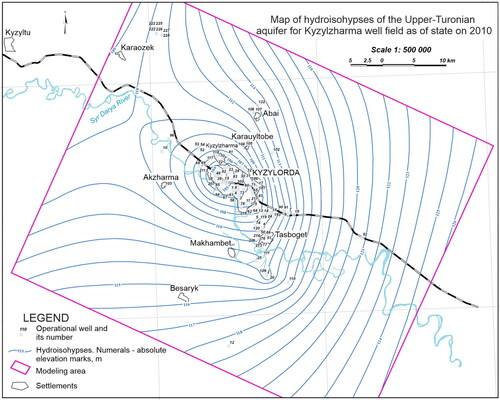
Figure 8. Observed and simulated groundwater level for well no. 351.
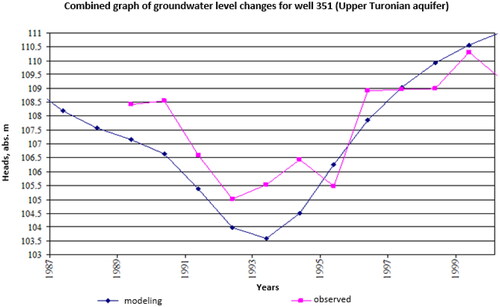
Figure 9. Observed and simulated groundwater levels for well No. 2561.
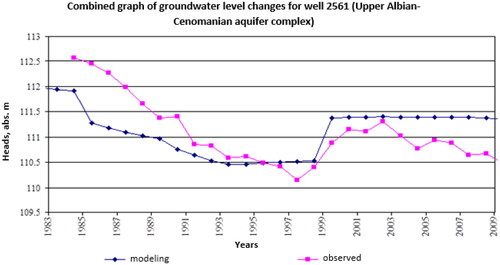
Figure 10. Prediction of groundwater levels in about 2040 in the Upper Turonian aquifer.
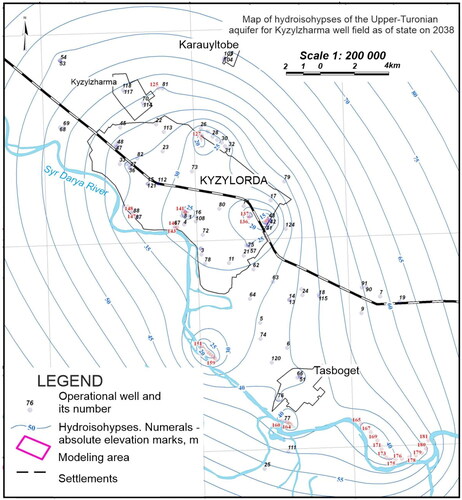
Figure 11. Drawdown of groundwater level in about 2040 compared to 2010 in the Upper Turonian aquifer.
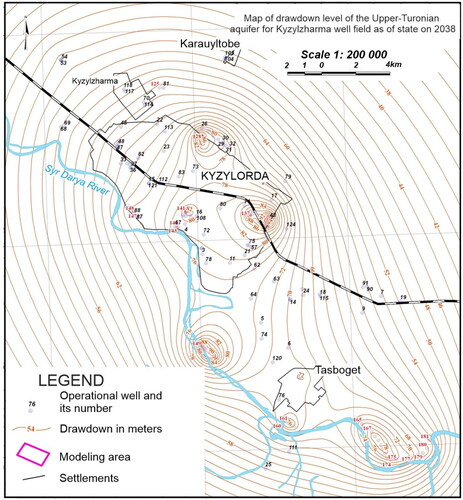
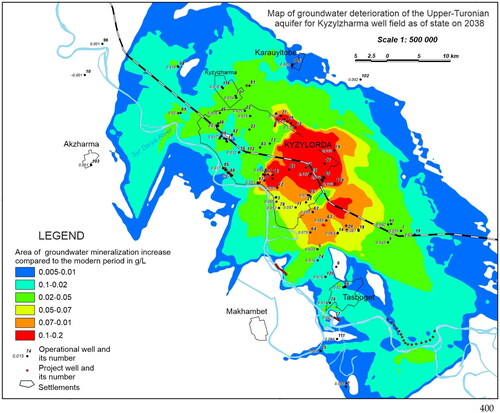
Figure 12. Predicted mineralization of groundwater (total dissolved solids) in about 2040.
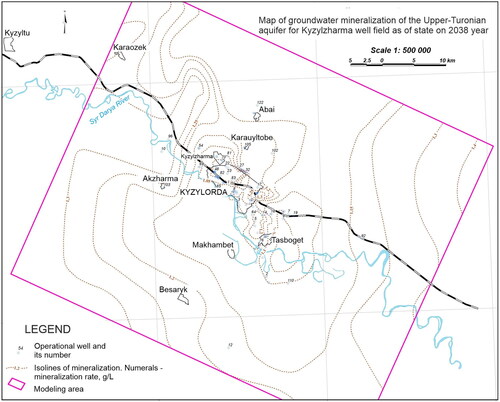
Figure 13. Predicted increase in sulfate concentration in groundwater in around 2040.
Data availability statement
The data used in this study are available upon request from the corresponding authors.