
Figures & data
Figure 1. Typical density function of the PERT-beta distribution. Source: Hajdu and Bokor (Citation2016).
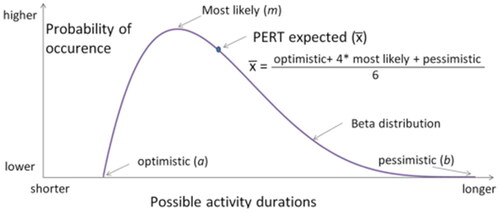
Table 1. Application of PERT analysis in construction projects.
Table 2. Problem formulation in research strategy.
Table 3. Validated risk factor.
Table 4. Critical path of a case study project.
Table 5. Qualitative risk analysis results: dominant risk in critical path activities.
Table 6. Quantitative analysis inherent risk using with the PERT distribution method.
Table 7. Number of model iterations and confidence level in several other studies.
Table 8. The PERT distribution model in a case study project with inherent risk.
Figure 2. Results of the strategy development FGD in the case study Project-1. Source: Author Processed Results, 2022.
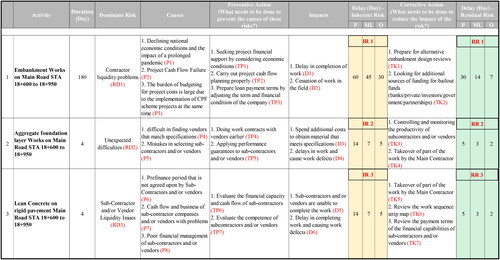
Figure 3. Results of the strategy development FGD in the case study Project-2. Source: Author Processed Results, 2022.
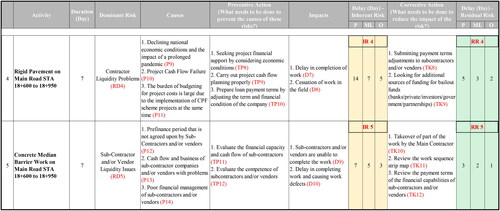
Figure 4. Risk Strategy Model on Main Road STA 18 + 600 to 18 + 950.
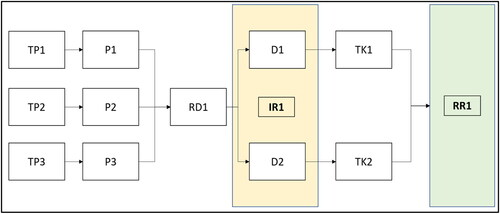
Figure 5. Risk Strategy Model on Main Road STA 18 + 600 to 18 + 950.
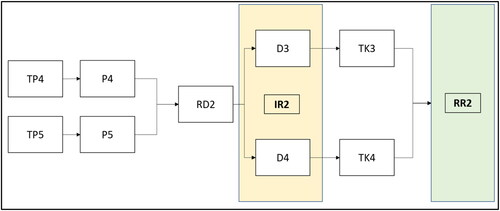
Figure 6. Risk Strategy Model on Main Road STA 18 + 600 to 18 + 950.
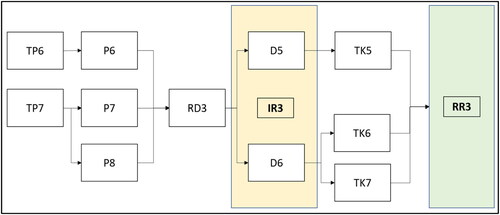
Figure 7. Risk Strategy Model on Main Road STA 18 + 600 to 18 + 950.
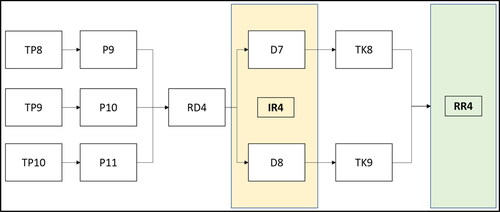
Figure 8. Risk Strategy Model on Main Road STA 18 + 600 to 18 + 950.
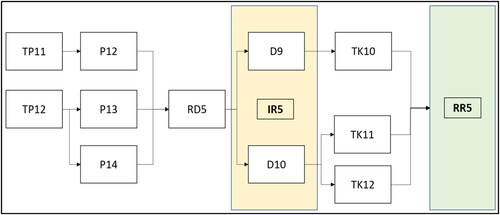
Table 9. Change of inherent risk value to residual risk value (days delay) after implementing the strategy on the critical path due to dominant risk.
Table 10. Quantitative analysis residual risk using with the PERT distribution method .
Table 11. The PERT distribution model in a case study project with residual risk.
Table 12. Comparison of time performance based on inherent and residual value schedule model.