
Figures & data
Figure 1. Overall methodology of this study.
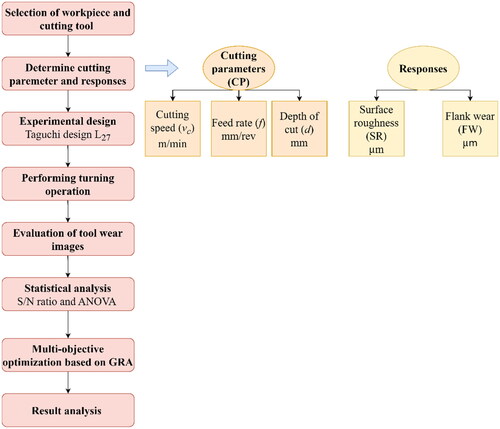
Figure 2. CNC turning center.
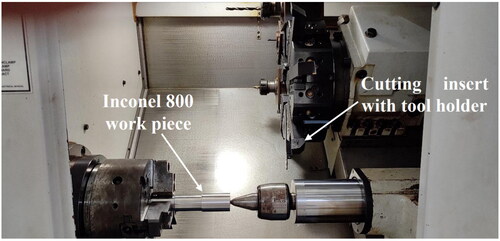
Figure 3. Cutting insert details.
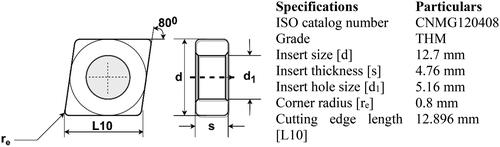
Table 1. Inconel 800 chemical composition (Gupta, Citation2018; Paul et al., Citation2019).
Table 2. CP considered in the study.
Table 3. Details of measuring instruments.
Table 4. CP and responses for the L27 experimental run.
Figure 4. SEM images of TW at various cutting speed and feed rate at depth of cut = 0.6 mm. (a) 175/0.15/0.6 (flank face). (b) 175/0.2/0.6 (flank face). (c) 200/0.2/0.6 (rake face). (d) 225/0.25/0.6 (rake face).
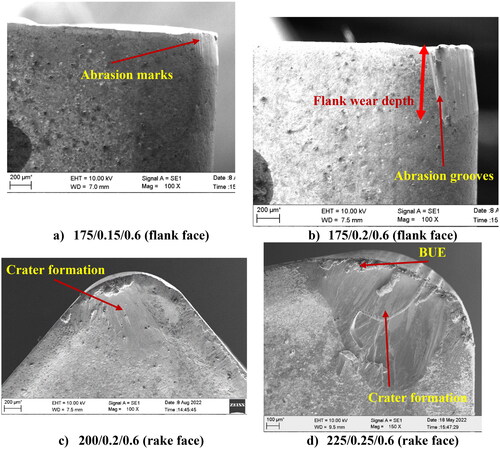
Figure 5. SEM images of TW at various cutting speed and feed rate at depth of cut = 0.8 mm. (a) 200/0.15/0.8 (rake face). (b) 225/0.25/0.8 (rake face).
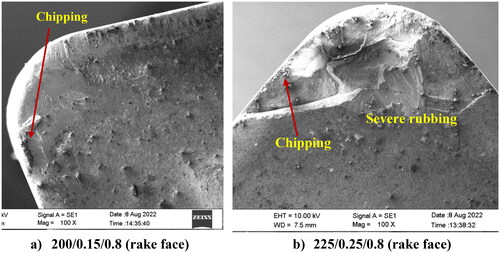
Figure 6. SEM images of TW at various cutting speed and feed rate at depth of cut = 1 mm. (a) 200/0.15/1 (flank face). (b) 200/0.15/1 (flank face). (c) 200/0.2/1 (rake face). (d) 200/0.2/1 (flank face). (e) 225/0.25/0.5. (f) 225/0.25/0.5.
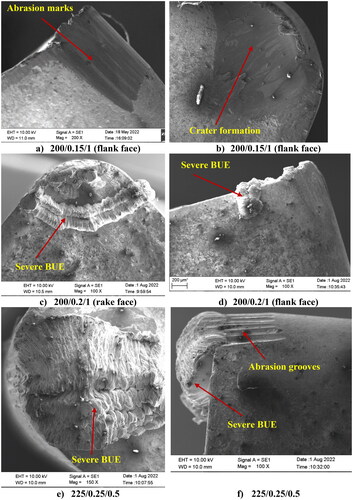
Figure 7. Effect of CP on SR: (a) mean effect plot and (b) S/N ratio plot.
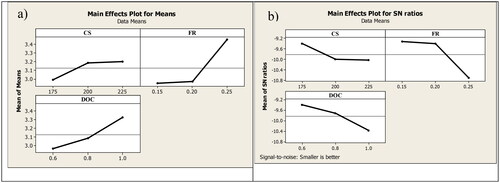
Figure 8. Effect of CP on FW: (a) mean effect plot and (b) S/N ratio plot.
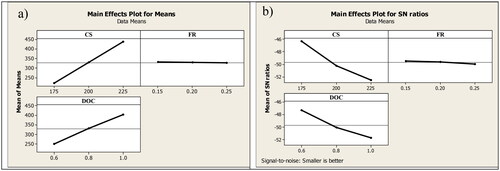
Table 5. ANOVA table for SR.
Table 6. ANOVA table for FW.
Table 7. GRA table.
Figure 9. GRG plot: (a) mean effect plot and (b) S/N ratio plot.
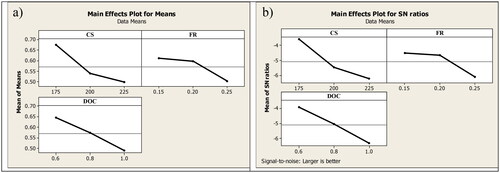
Table 8. Response table for GRG.
Table 9. ANOVA table for GRG.