
Figures & data
Figure 1. Schematic representation of the electrospinning process.
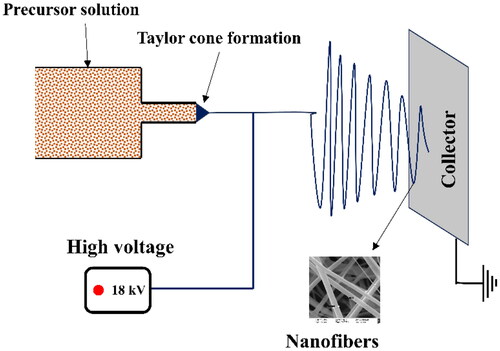
Figure 2. AFD of the NFs of (a) pure ZnO, (b) 1 w%, (c) 2 w%, (d) 3 w% and (e) 4 w% Cr-doped ZnO NFs.
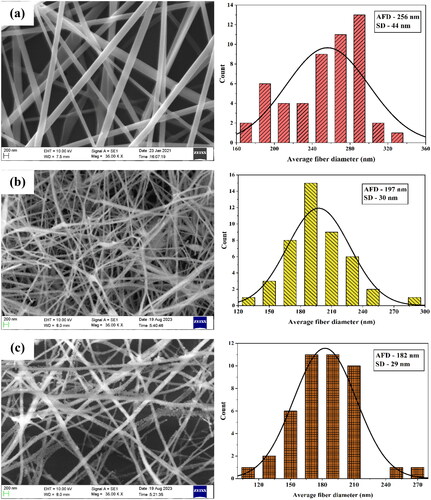
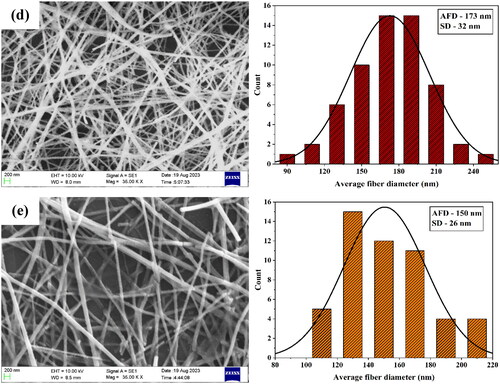
Figure 3. EDX mapping and spectra of 4 w% Cr-doped ZnO NF.
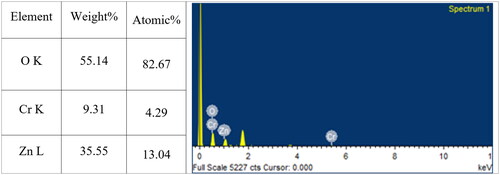
Figure 4. XRD patterns of the undoped and various concentrations of Cr-doped ZnO NFs.
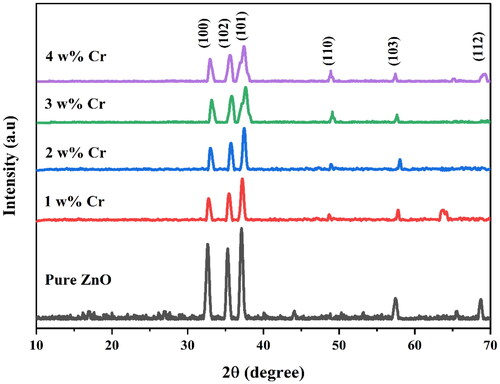
Figure 5. Transmission and bandgap energy spectra of (a) pure ZnO and (b–e) 1, 2, 3 and 4 w% Cr-doped ZnO NFs.
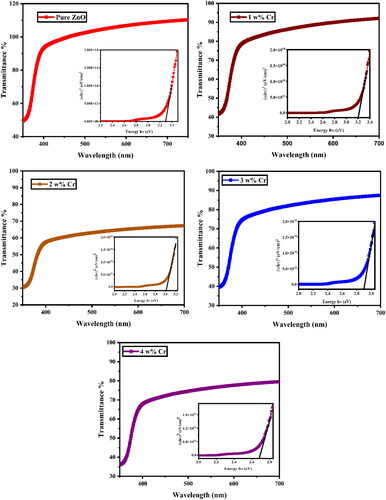
Figure 6. Sensing mechanism for acetone vapor.
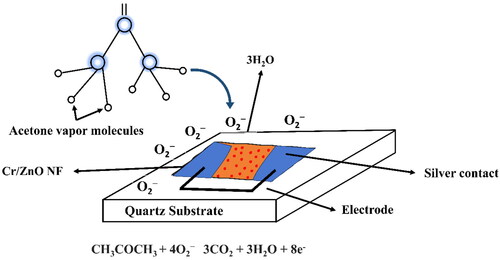
Figure 7. Response of the undoped and Cr-doped ZnO NFs to acetone vapor.
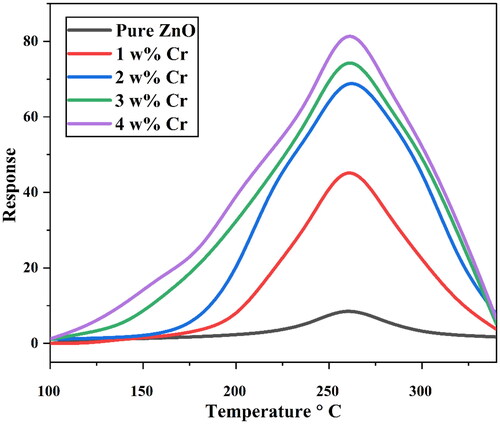
Table 1. Comparison of sensing parameters for acetone vapor.
Figure 8. Transient responses of the 4 w% Cr-doped NFs for various concentrations of acetone ethanol vapor.
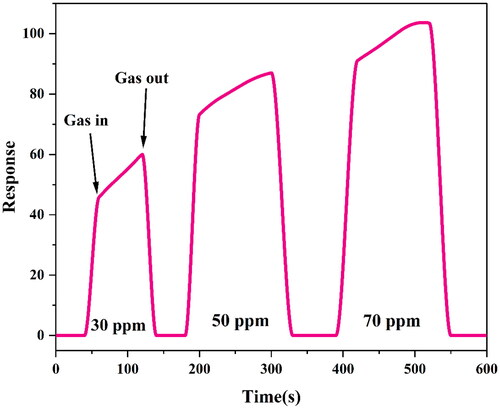
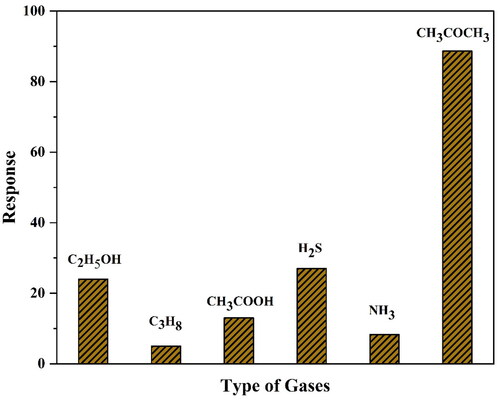
Figure 9. Sensitivity of the ZnO nanostructured sensors to a variety of VOCs.
Data availability statement
The authors confirm that the data supporting the findings of this study are available within the article.