
Figures & data
Figure 1. (A) GPS module; (B) Hall effect sensor; (C) Rotary potentiometer; (D) Three-point hitch dynamometer.
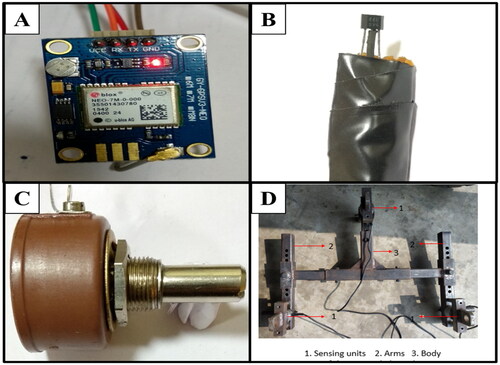
Table 1. Transducers and their specifications.
Figure 2. Geo position data points on the field.
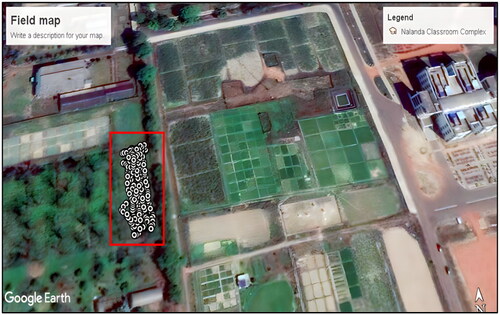
Figure 3. Setup for (A) speed measurement; (B) depth measurement.
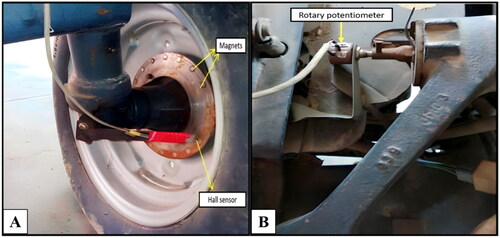
Figure 4. Calibration setup for (A) load cell in compression; (B) load cell in tension; (C) depth measurement.
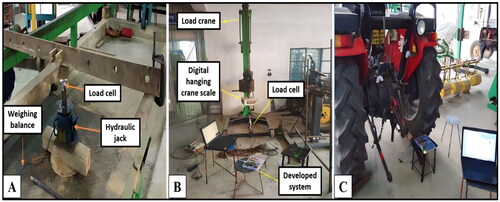
Figure 5. Calibration curve (A) load cell in compression; (B) load cell 1 in tension; (C) load cell 2 in tension; (D) for depth measurement.
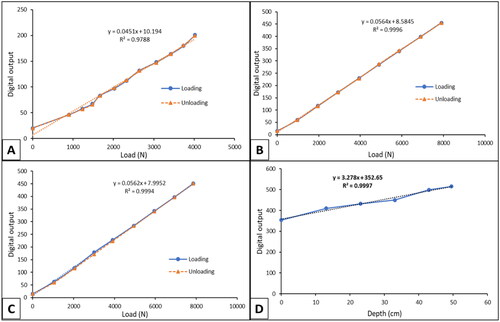
Figure 6. Circuit diagram of the developed embedded system.
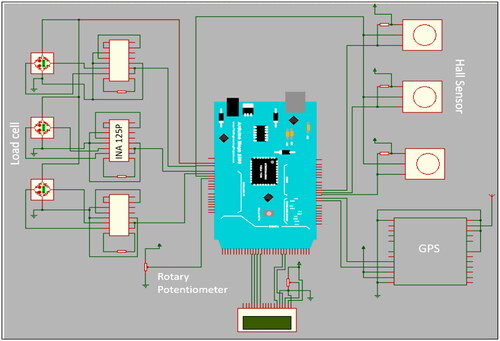
Figure 7. Developed embedded system (A) front view; (B) inner view; (C) side view.
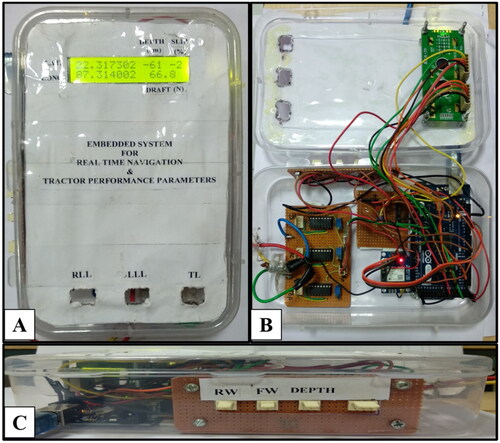
Figure 8. Field test with (A) cultivator; (B) harrow.
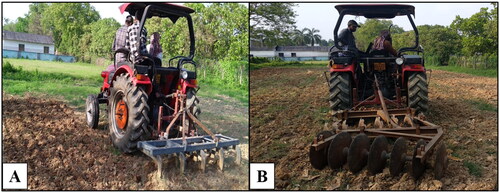
Figure 9. Validation of speed measurement.
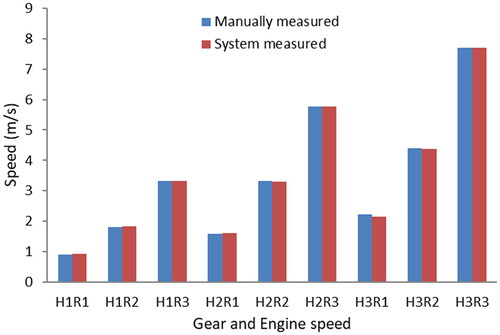
Figure 10. Validation of depth measurement.
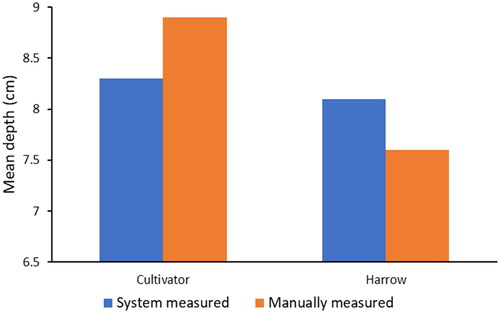
Figure 11. Measured and predicted draft variations with time (A) cultivator; (B) harrow.
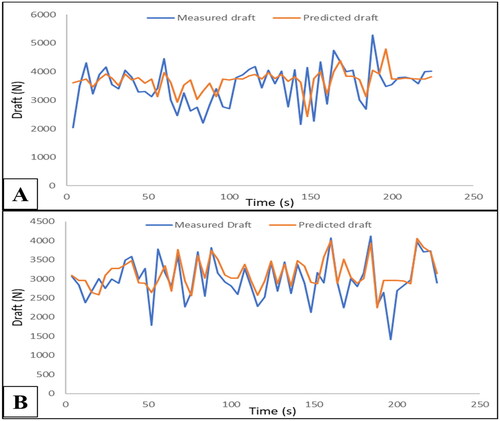
Figure 12. Comparison of measured and predicted draft for (A) cultivator; (B) harrow.
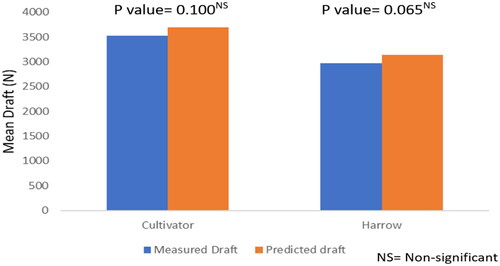
Figure 13. Spatial variability maps of (A) tillage depth; (B) draft force; (C) wheel slip; (D) travel speed for the cultivator.
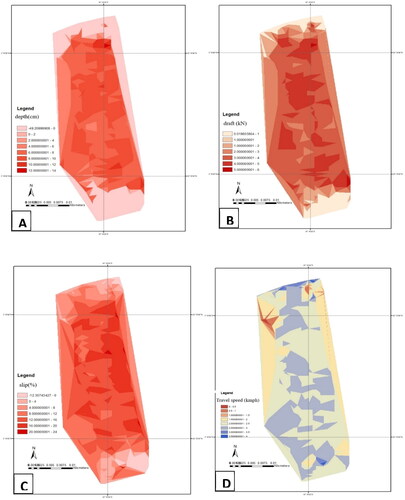
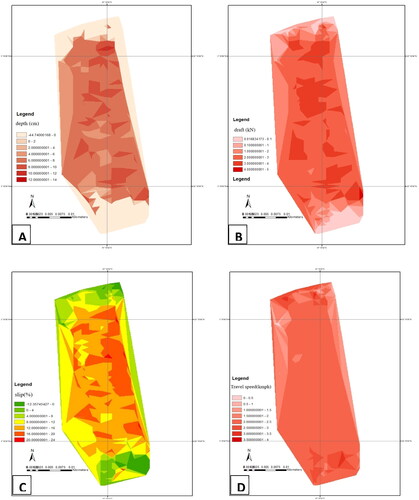
Figure 14. Spatial variability maps of (A) tillage depth; (B) draft force; (C) wheel slip; (D) travel speed for disk harrow.
Data availability statement
The original contributions presented in the study are included in the article; further inquiries can be directed to the corresponding author.