
Figures & data
Figure 1. Sagittal plane kinematic trajectories of the hip, knee and ankle for a representative participant walking at 1.0 m/s in the four different joint constraint conditions indicating that the constraints functioned as intended to alter gait.
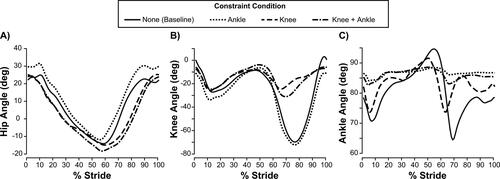
Table 1. Statistical comparisons between conditions showing p-values, and significant (p ≤ 0.05) differences between constraint condition comparisons and speed condition comparisons are in bolded text with an asterisk*.
Figure 2. Results of Prosthetic Observational Gait Score indicating differences between baseline and knee and knee + ankle constraint conditions as well as between ankle and knee + ankle and knee + ankle. Error bars represent the standard deviation across participants. † indicates significant difference compared to baseline condition, ‡ indicates significant difference compared to ankle condition.
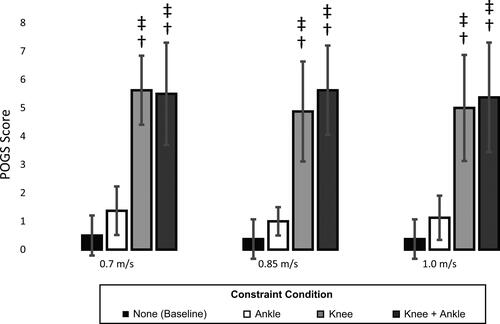
Figure 3. Results of Impulse Asymmetry indicating significant differences seen between knee + ankle constraint and every other constraint condition. Error bars represent the standard deviation across subjects. † indicates significant difference compared to baseline condition, ‡ indicates significant difference compared to ankle condition, ⋄ indicates significant difference from knee condition.
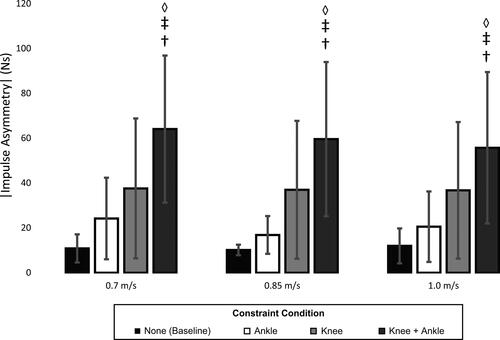
Figure 4. Results of Lateral Sway metric indicating differences seen in speed and joint constraint comparisons between the baseline and ankle constraint and knee + ankle conditions as well as between the ankle constraint and knee + ankle conditions. Error bars represent the standard deviation across participants. *indicates significant difference compared to 0.7 m/s speed, † indicates significant difference compared to baseline condition, ‡ indicates significant difference compared to ankle condition.
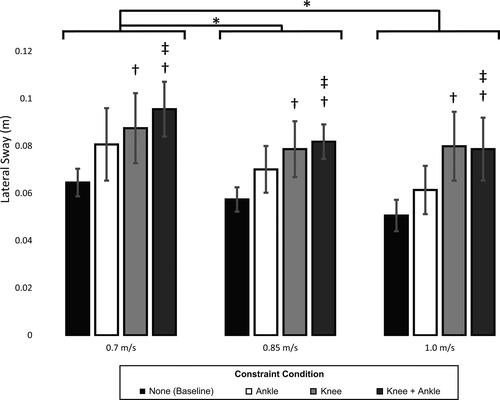
Figure 5. Results of Gait Deviation Index indicating significant differences between the baseline (i.e., GDI = 100) and every other constraint condition as well as differences between the ankle constraint and knee + ankle conditions. Error bars represent the standard deviation across participants. † indicates significant difference compared to baseline condition, ‡ indicates significant difference compared to ankle condition.
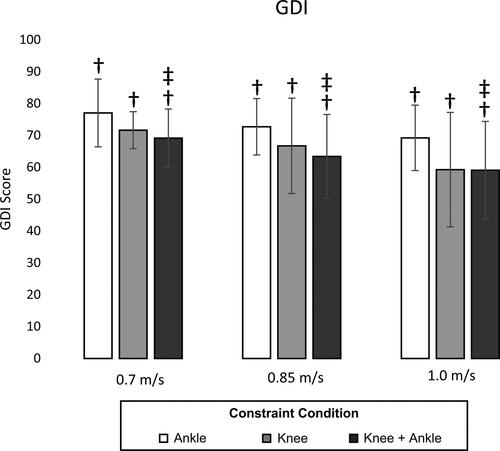
Table 2. Post hoc power analysis indicating high power (>0.95) when assessing the main effect of joint constraint and Lateral Sway as the only metric with sufficient power to detect the main effect of speed.
Data availability statement
The data that support the findings of this study are available from the corresponding author, KH, upon reasonable request.